Q3 2023 Review
Click to download the PDF
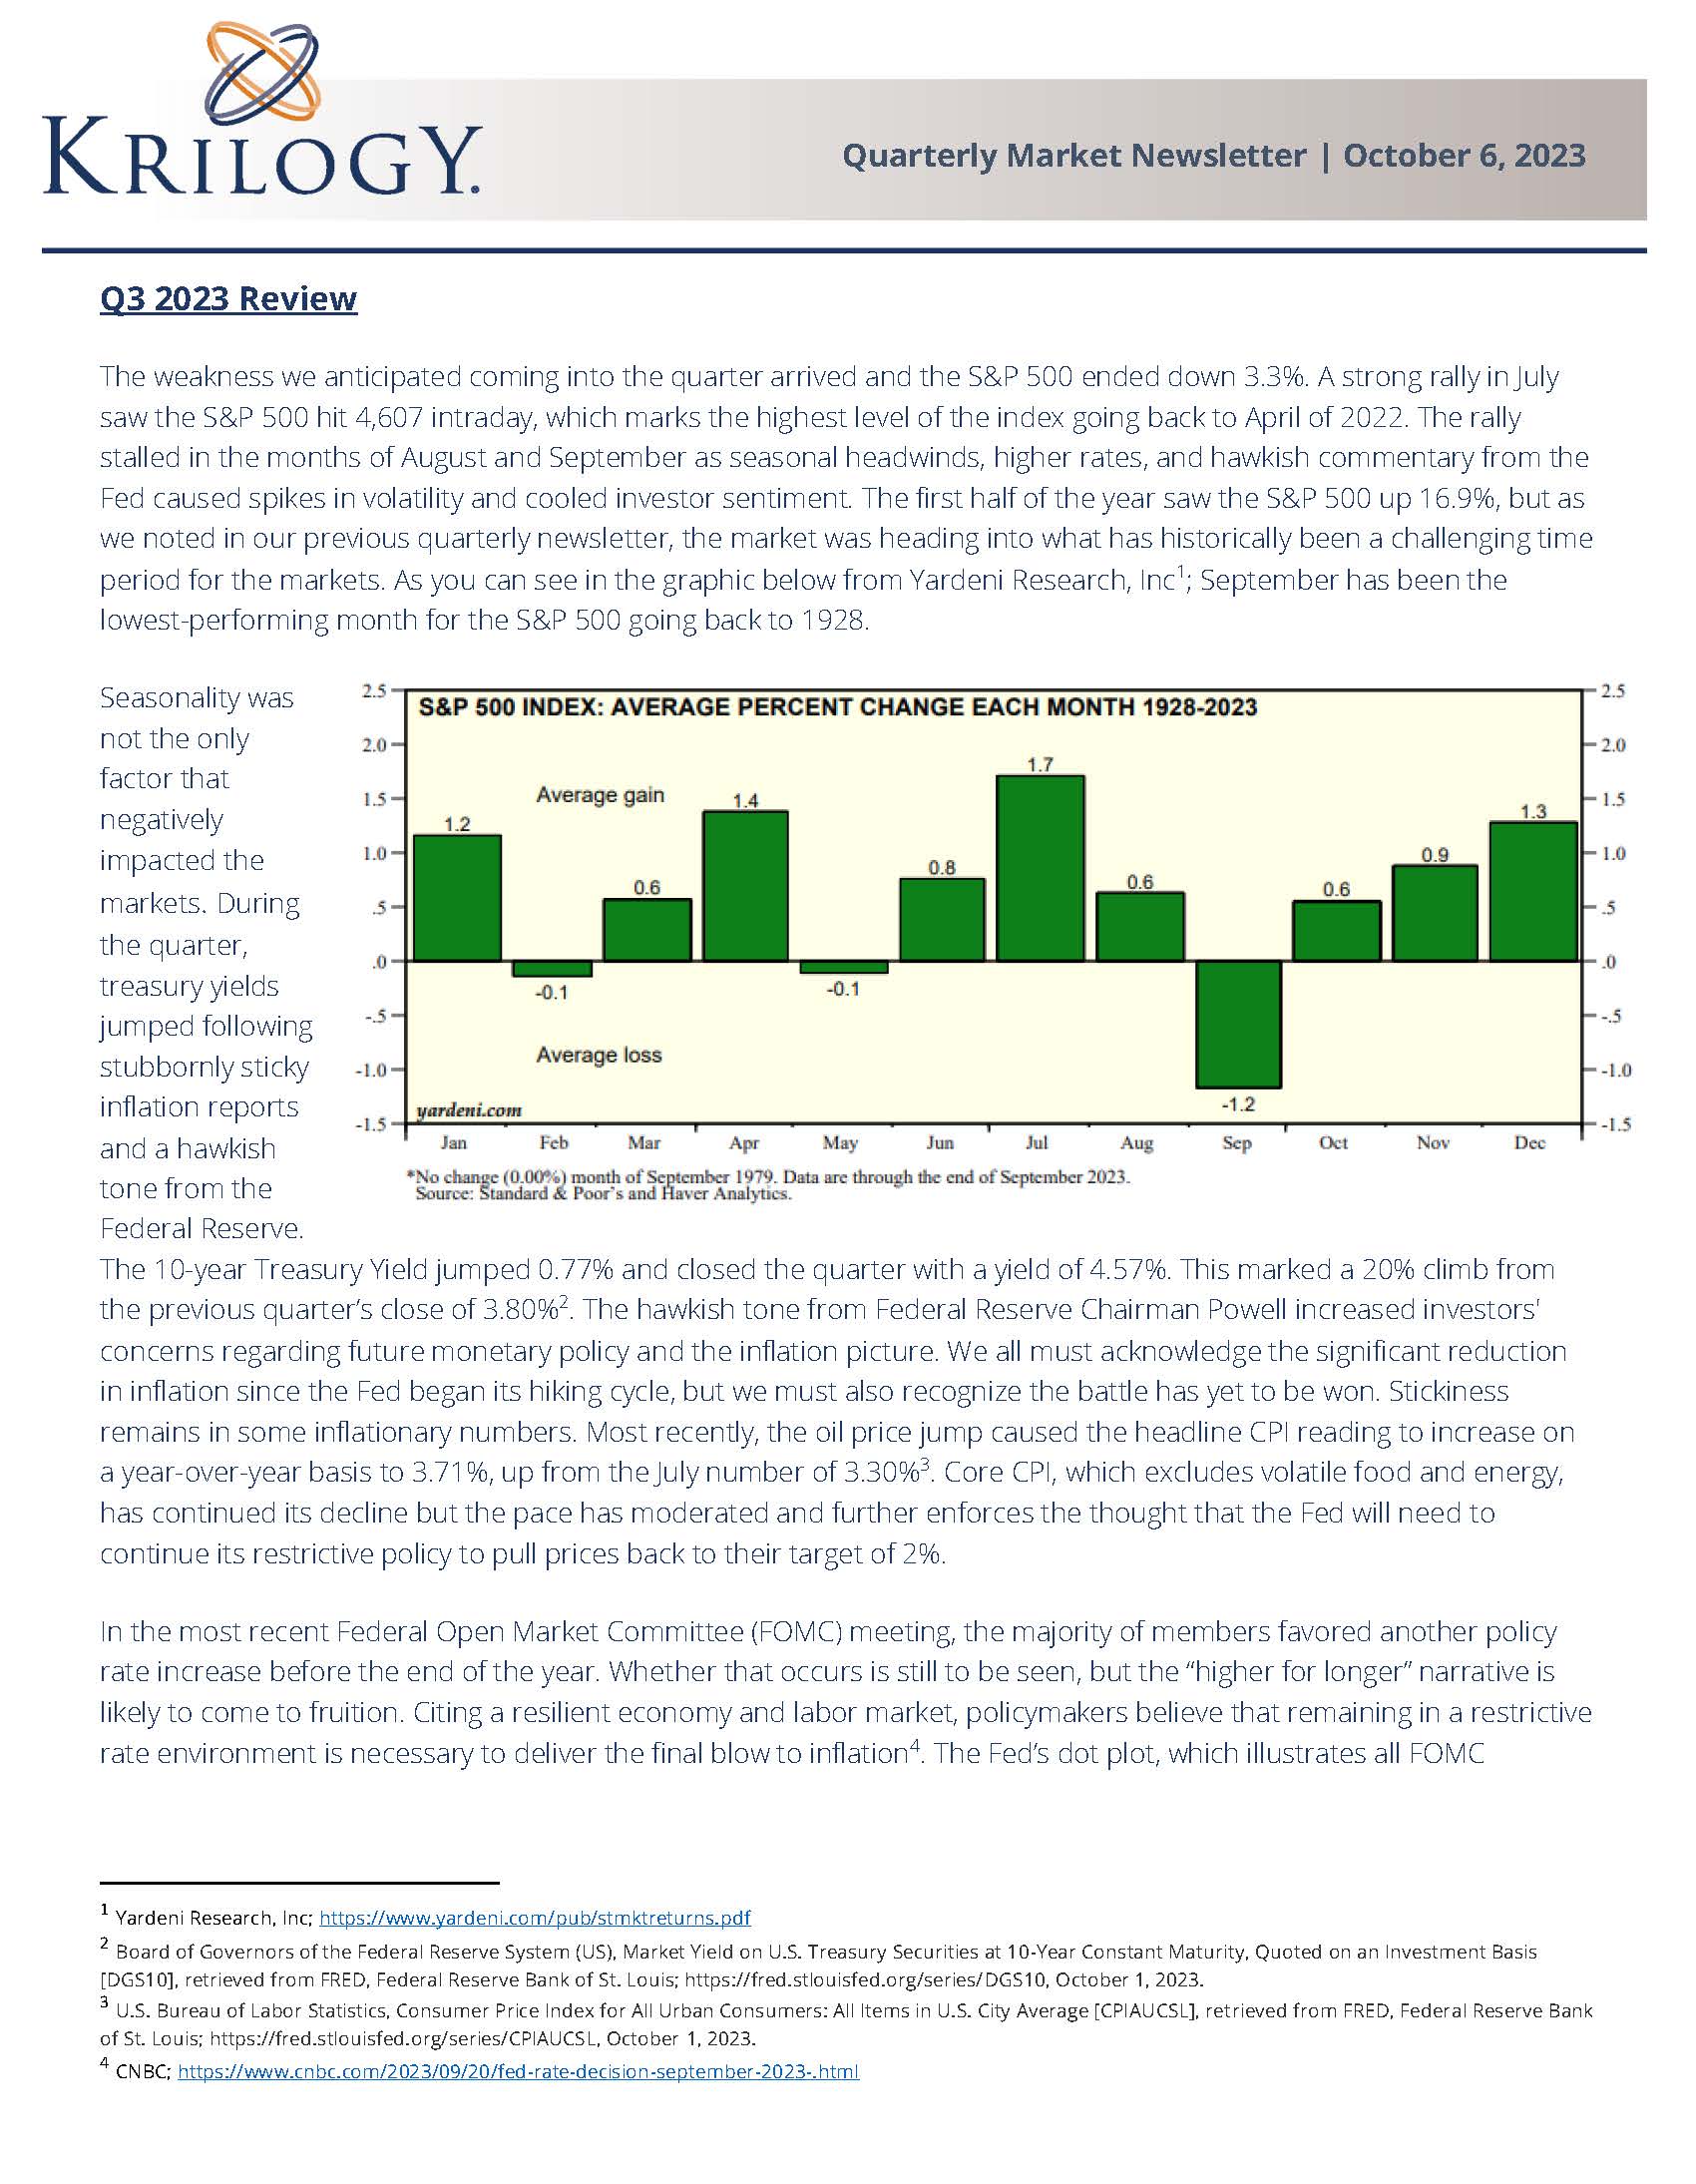
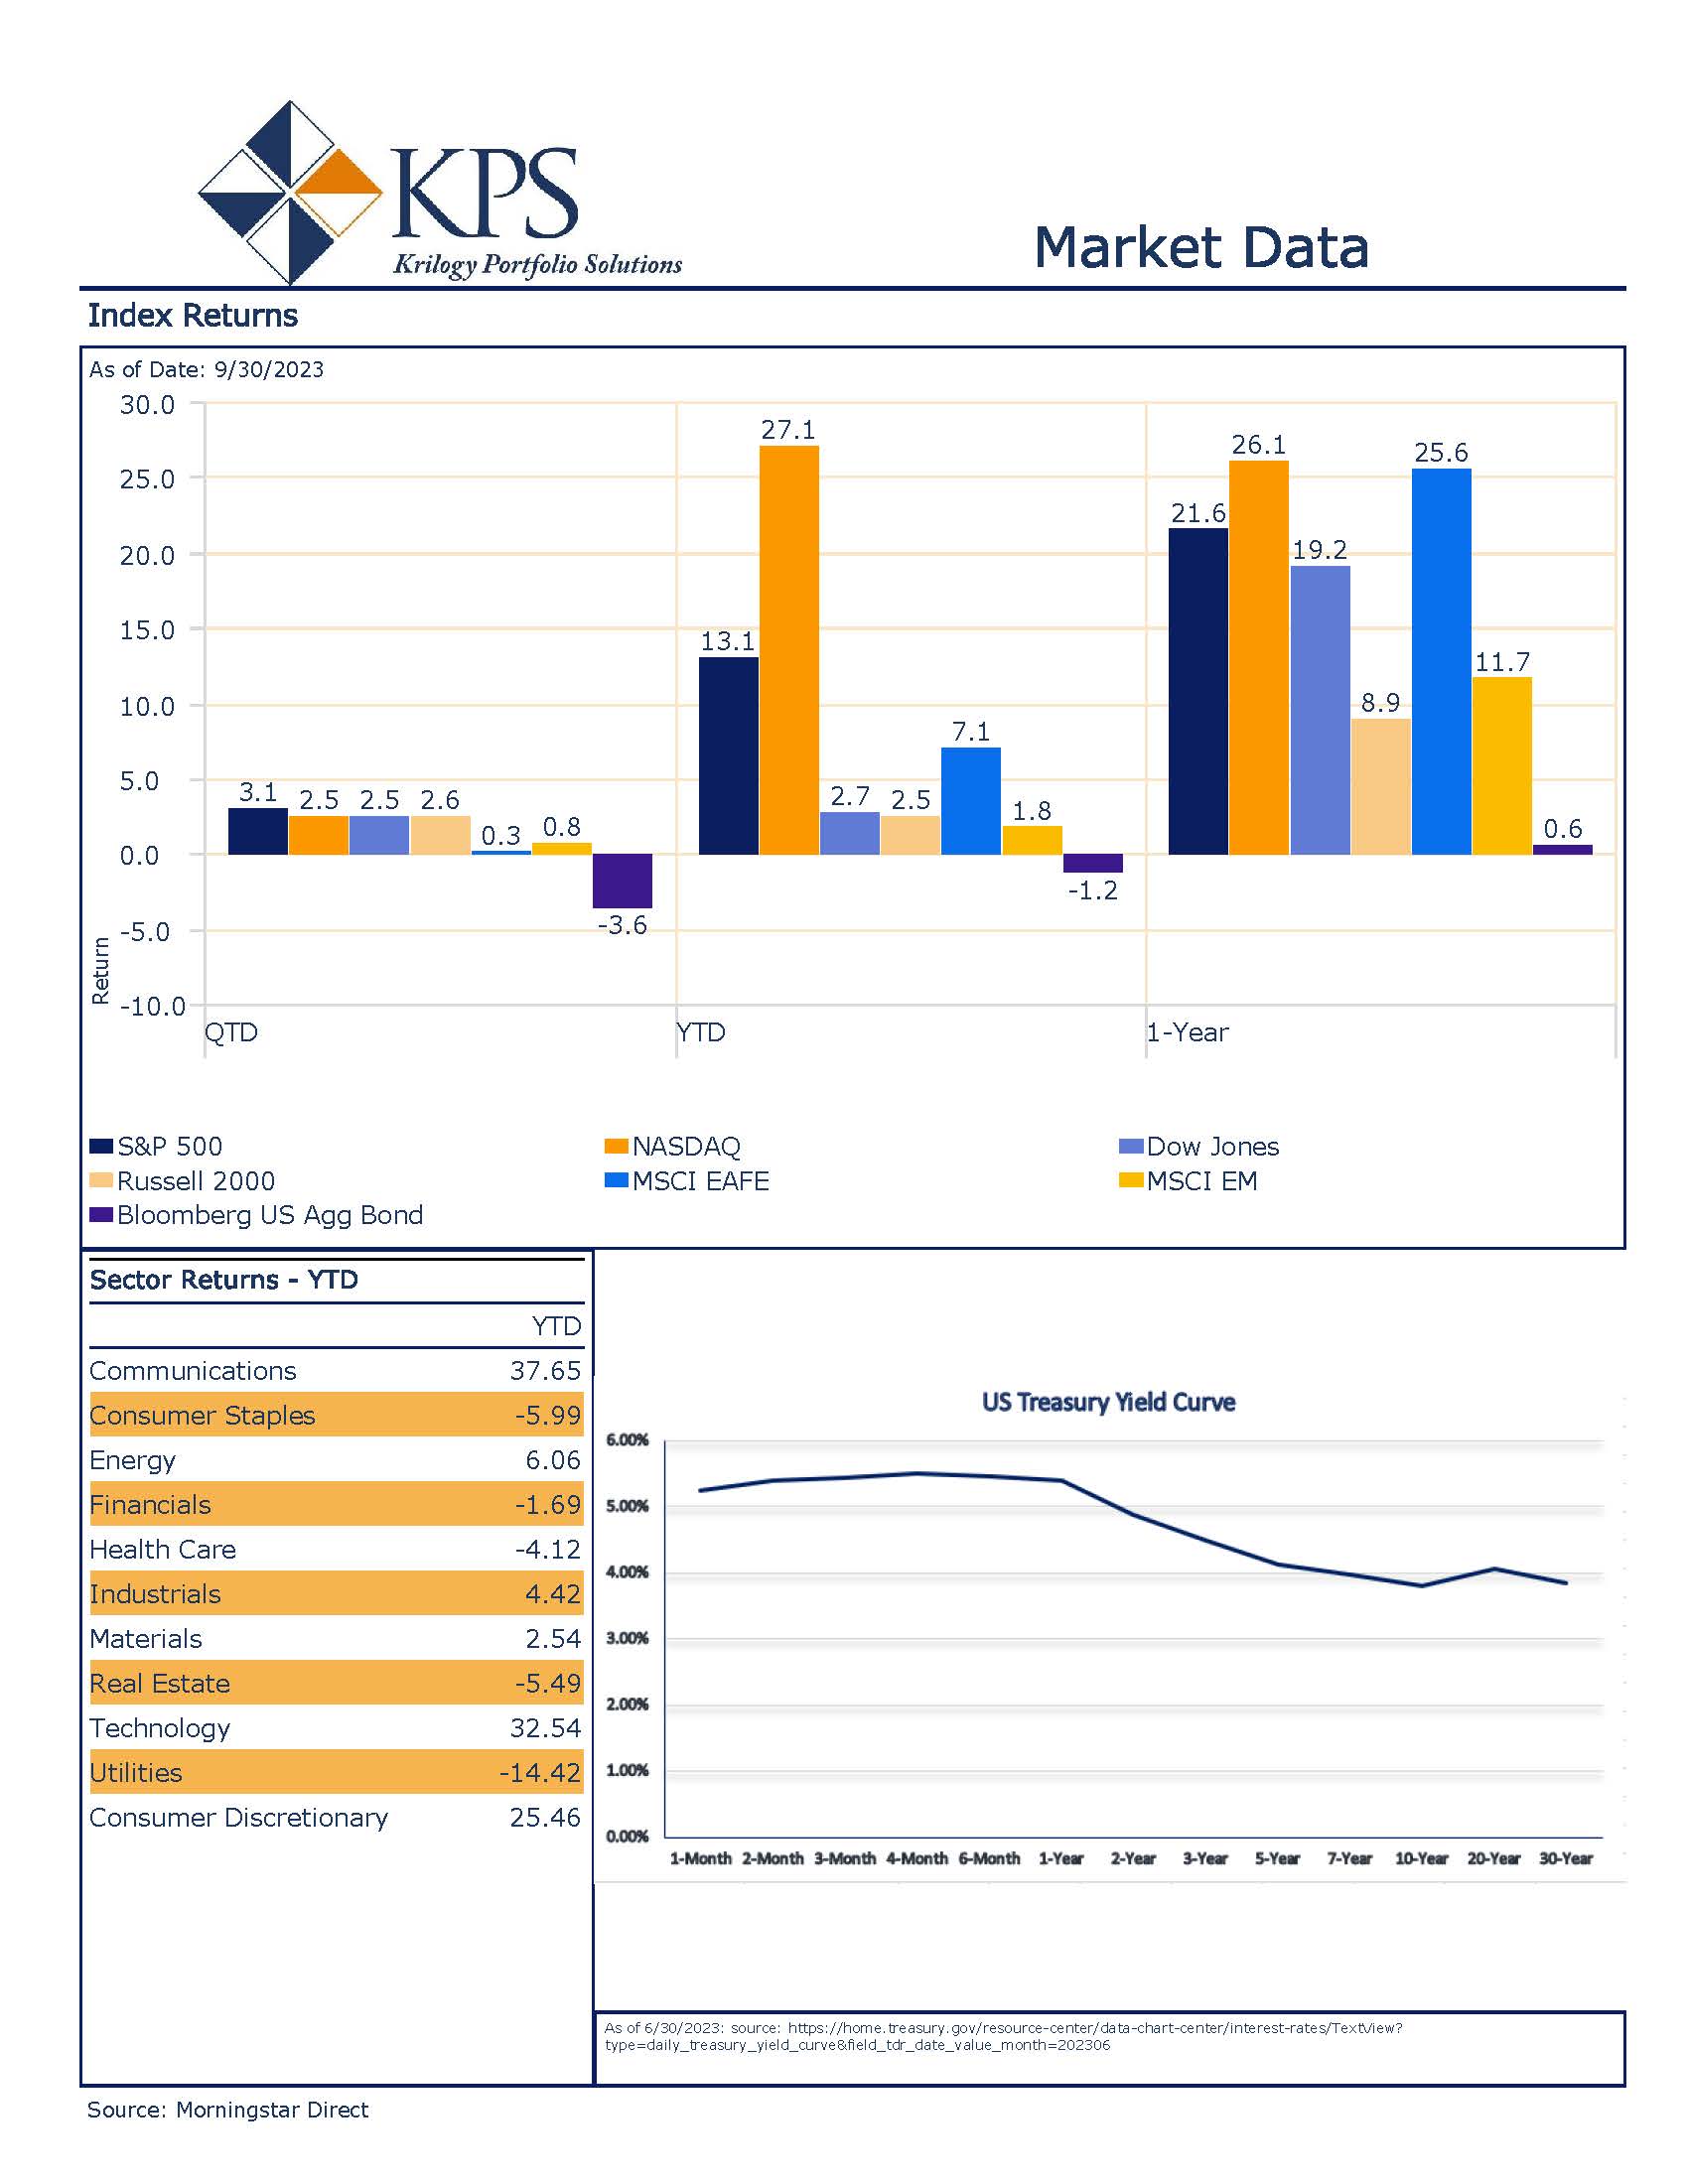
The weakness we anticipated coming into the quarter arrived and the S&P 500 ended down 3.3%. A strong rally in July saw the S&P 500 hit 4,607 intraday, which marks the highest level of the index going back to April of 2022. The rally stalled in the months of August and September as seasonal headwinds, higher rates, and hawkish commentary from the Fed caused spikes in volatility and cooled investor sentiment. The first half of the year saw the S&P 500 up 16.9%, but as we noted in our previous quarterly newsletter, the market was heading into what has historically been a challenging time period for the markets. As you can see in the graphic below from Yardeni Research, Inc[1]; September has been the lowest-performing month for the S&P 500 going back to 1928.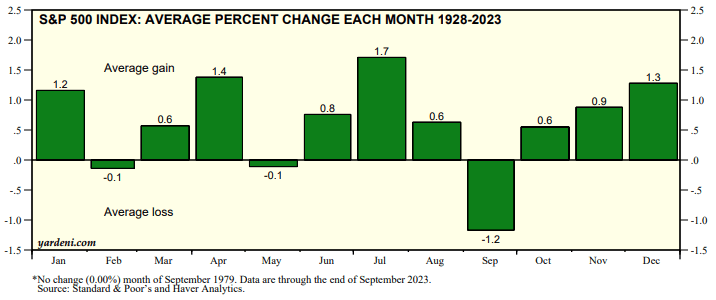
Seasonality was not the only factor that negatively impacted the markets. During the quarter, treasury yields jumped following stubbornly sticky inflation reports and a hawkish tone from the Federal Reserve. The 10-year Treasury Yield jumped 0.77% and closed the quarter with a yield of 4.57%. This marked a 20% climb from the previous quarter’s close of 3.80%[2]. The hawkish tone from Federal Reserve Chairman Powell increased investors’ concerns regarding future monetary policy and the inflation picture. We all must acknowledge the significant reduction in inflation since the Fed began its hiking cycle, but we must also recognize the battle has yet to be won. Stickiness remains in some inflationary numbers. Most recently, the oil price jump caused the headline CPI reading to increase on a year-over-year basis to 3.71%, up from the July number of 3.30%[3]. Core CPI, which excludes volatile food and energy, has continued its decline but the pace has moderated and further enforces the thought that the Fed will need to continue its restrictive policy to pull prices back to their target of 2%.
In the most recent Federal Open Market Committee (FOMC) meeting, the majority of members favored another policy rate increase before the end of the year. Whether that occurs is still to be seen, but the “higher for longer” narrative is likely to come to fruition. Citing a resilient economy and labor market, policymakers believe that remaining in a restrictive rate environment is necessary to deliver the final blow to inflation[4]. The Fed’s dot plot, which illustrates all FOMC member’s interest rate forecasts, showed that there is now an expectation for only two rate cuts next year, down from the June forecast of four[5].
Third-quarter earnings were better than feared but for the three consecutive quarters, S&P 500 earnings declined. The year-over-year earnings decline was 2.8%, while estimates at the beginning of the quarter were expecting a decline of 5.7[6]. Below is a glimpse at earnings from the sector level[7]. Only three out of eleven sectors saw a year-over-year decline in earnings. We believe that investors should also look at the earnings beat rate of the companies within a sector. When calculating earnings per share changes, companies are equally weighted rather than market capitalization weighted. Real Estate, which had the largest yearly EPS change, saw 72% of the underlying companies have negative year-over-year earnings. We believe paying close attention to actual earnings growth, along with beating analysts’ estimates, provides a more holistic view of the health of the market.
Earnings beat rates have remained high across the majority of sectors, in large part due to steep downward revisions to earnings estimates by analysts. At the beginning of the year, second quarter 2023 earnings estimates were showing a small decline of -0.3%. However, estimates continued to be revised lower through July 1st of this year; estimates had earnings declining 5.7%. The overly pessimistic outlook from market analysts and participants was a perfect set-up for beating street expectations while still week earnings growth.
Q3 2023 Outlook
Equity Market
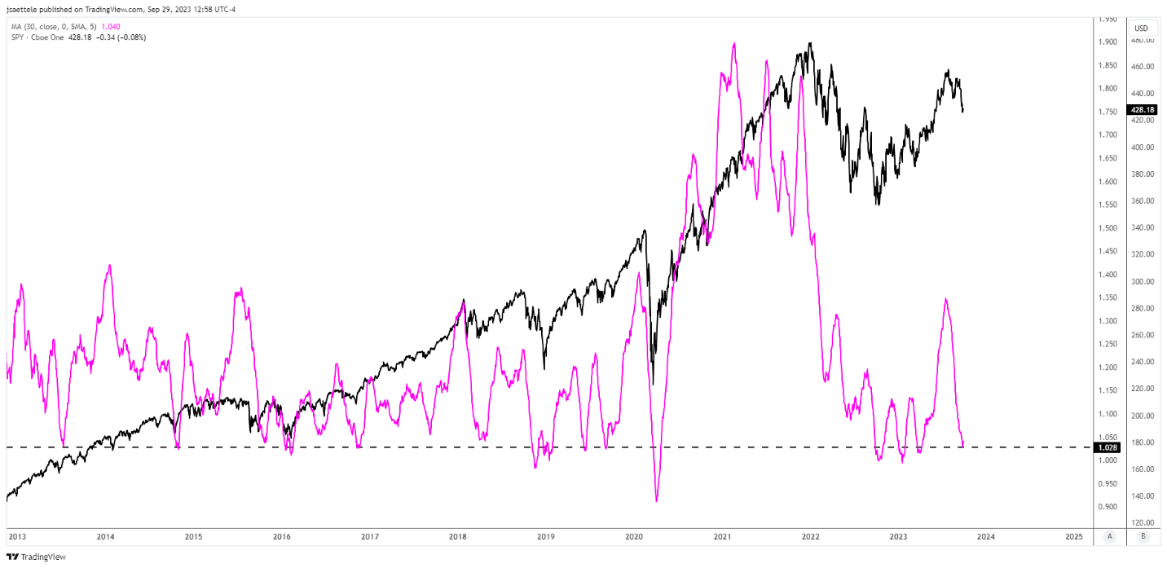
Market sentiment to start the final quarter of 2023 is low, and fear increased significantly in September. On the following page is a chart of the 30-day average of the CBOE Put/Call Ratio. The magenta line indicates heavy put buying activity relative to call options; which indicates high levels of fear by investors. The Put/Call Ratio is graphed inversely so it trends in the same direction as the S&P 500[8], the black line. When the magenta line is at a low reading market sentiment is bearish, which is a bullish contrarian view. We believe this ratio indicates the possibility of a low in the near term prior to a melt-up through year-end.
As we move to our longer-term view, we still believe that market fundamentals and earnings will be the driving force for a sustained market move. Earnings estimates have stabilized for now, following multiple quarters of large downward revisions. The pessimism created an environment for companies to outperform expectations but on a go forward, beating expectations may be more difficult.
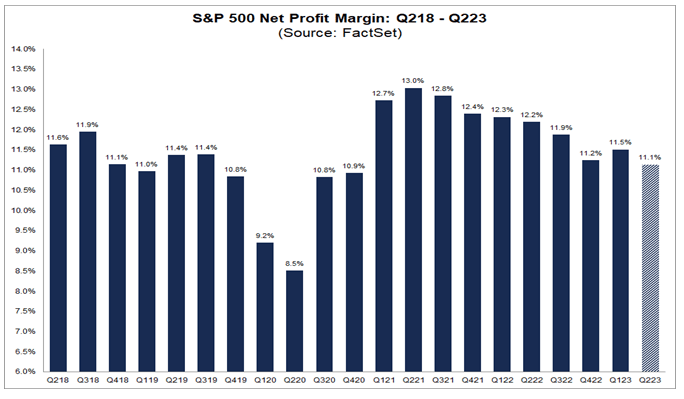
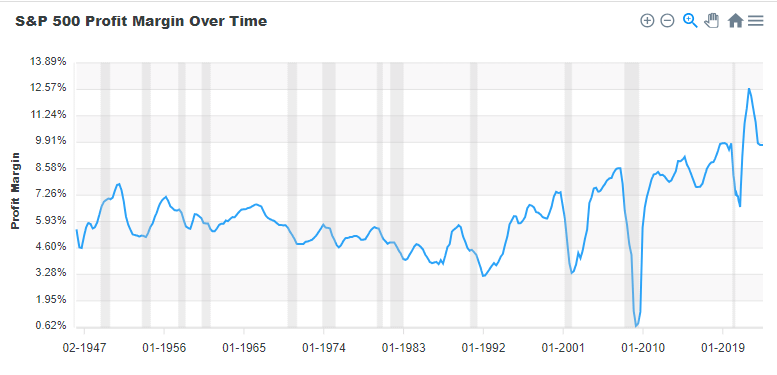
One area we will pay close attention to over the coming quarters is profit margins. Coming out of the liquidity-fueled pandemic, corporate profit margins were near all-time highs. They have come down nearly 2% from the high in the second quarter of 2021, which you can see in the chart on the right[9]. These profit margins have significantly helped companies stabilize in the face of rate hikes and multi-decade-high inflation over the past 2 years. Despite margins dropping below recent trends, from a historical perspective, they still remain strong. The graph below shows the profit margin for the S&P 500 dating back to 1946[10].
It is not our opinion that we will see margin compression to the low end of the range, but the ability to continue passing on inflation to consumers may become more challenging if the consumer continues its softening trend. The ability to pass along input cost increases to consumers does not appear to be a feasible strategy as a softening trend has started in the consumer base.
Long-term investors purchase a share in a company with the hope of receiving some economic benefit in the future; whether through dividends, stock buybacks, and/or share price appreciation. We believe that the multiple at which the purchase takes place at makes a difference, and will have an impact on expected future returns. The chart from BofA Merrill Lynch shows the normalized Price-To-Earnings Ratio’s predictive power on the S&P 500’s variability of returns over various time periods[11]. We acknowledge the potential short-term challenges when investing rooted in a fundamental point of view. In the near term, valuations mean little and have little to no predictive power in returns, but matter more, as you move to timeframes that encompass the length of full market cycles historically.
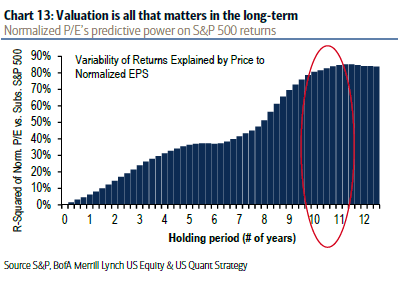 The predictive power breaches 70%. Market Fundamentals don’t matter; until they do. The S&P 500 currently trades at 18.5x forward four-quarter earnings (23Q3-24Q2)[12]. The market at these levels is not what we consider extremely expensive, but is near the top end of the range. There is still room for multiple expansion which could help fuel a potential rally into the end of the year. We believe that in order to see a sustained market rally, the denominator in the P/E ratio, earnings, will need to improve. Given the current interest rate environment, multiple expansion is likely to be more difficult than the previous cycle.
However, we believe we are later cycle and we will look to yield curve dynamics and energy sector performance for early indicators of potential near-term stock market weakness. This portion of the yield curve has been inverted for nearly 15 months; July 6, 2022 marked the inversion. Many investors look to this inversion as a recession warning. The uncertainty is the timing of the eventual recession. Since 1955, the start of the recession has ranged from six to 24 months following the inversion[13]. Below is a chart of the yield spread between the 10-year Treasury and the 2-year Treasury, in black, the S&P 500 in Magenta, with the green vertical bars representing recessions[14].
U.S. 10 YR YIELD-U.S. 2 YEAR YIELD (BLACK) AND S&P 500 (MAGENTA)
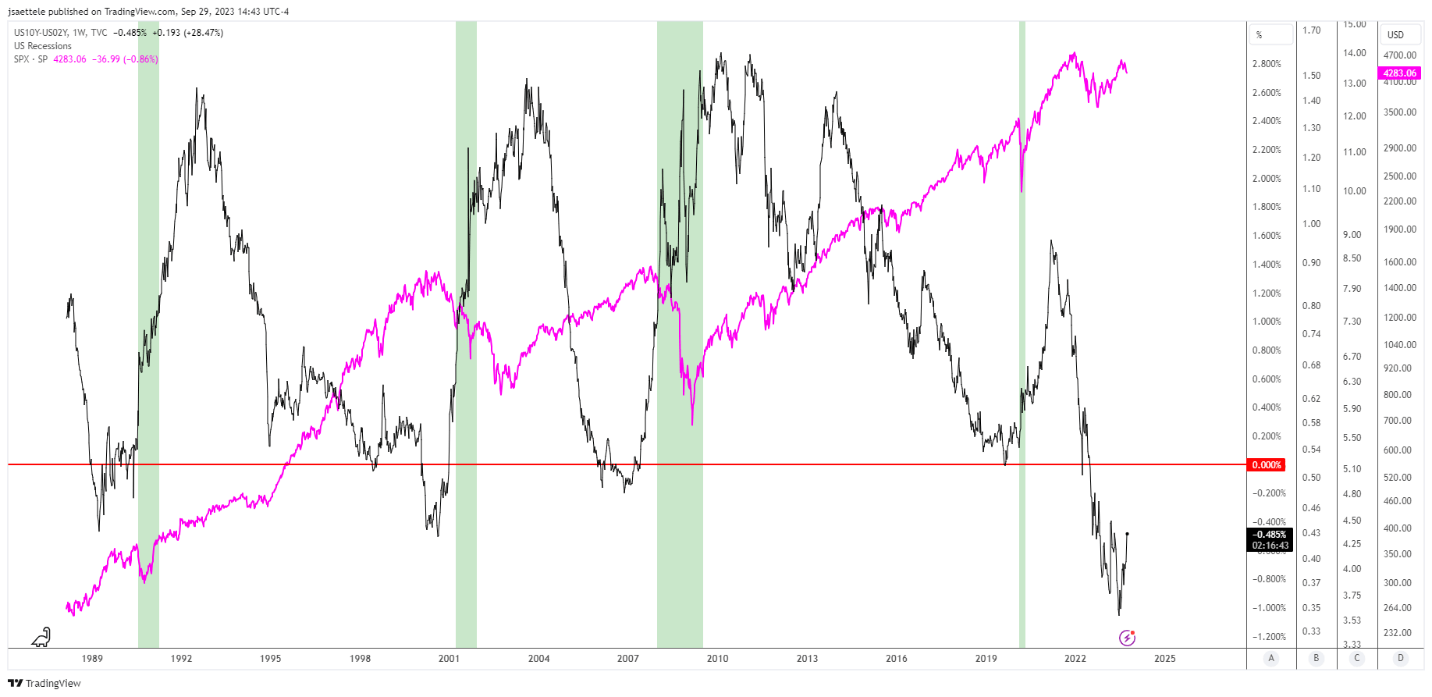
Prior to all of the recessions, going back 30 years, the yield curve steepens and un-inverts just prior to the beginning of the official recession and has coincided with S&P 500 levels near the top of that cycle. We will also pay close attention to the energy sector’s performance. In previous recessions, energy has topped during a recession, and well after the broader market has topped. For example, the XLE top in May 2001 was coincident with a lower high in the S&P 500 during the recession that began in March 2001. Similarly, the XLE top in May 2008 coincided with a lower high in the S&P 500 during the recession that began in December 2007 as shown in the following chart[15].
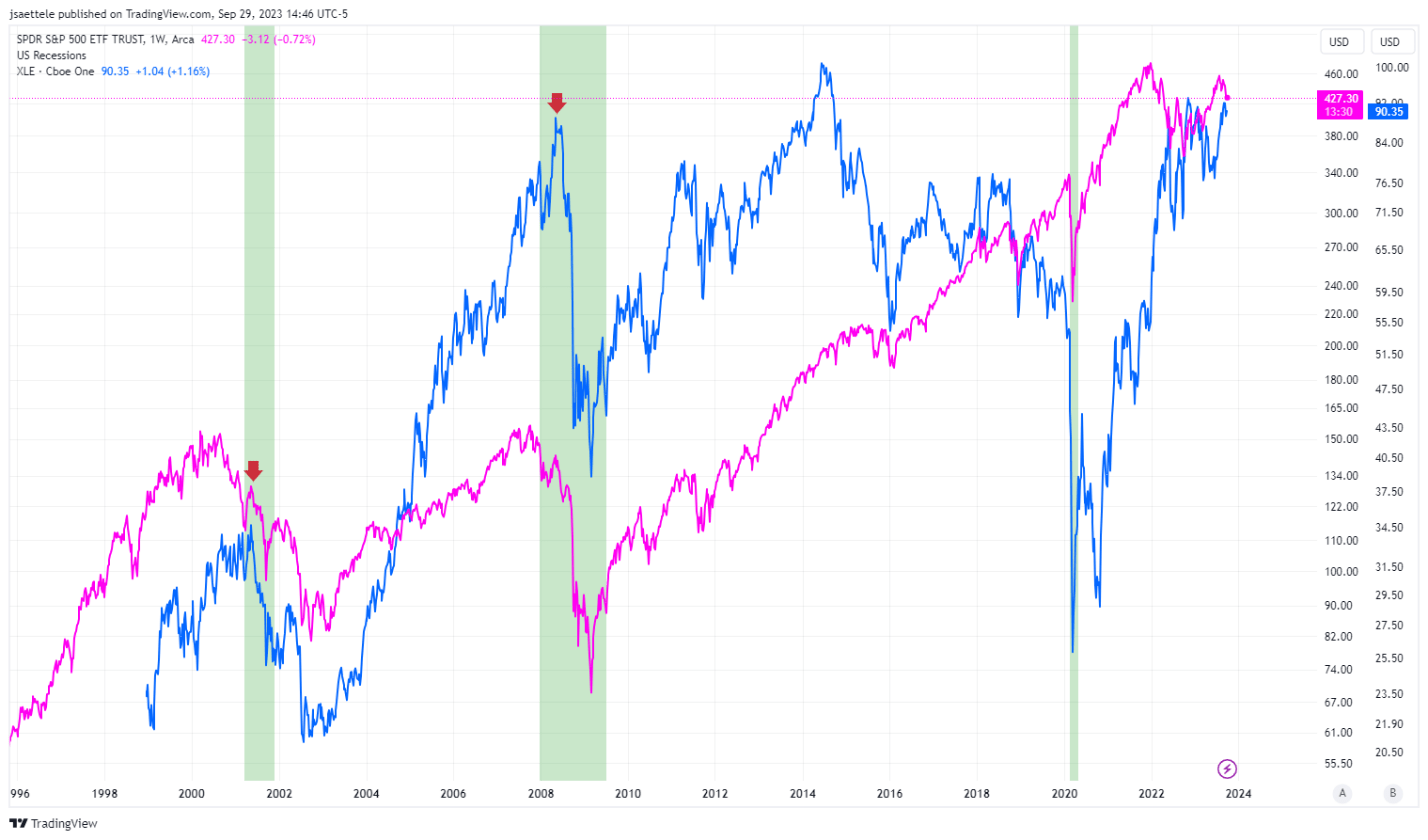
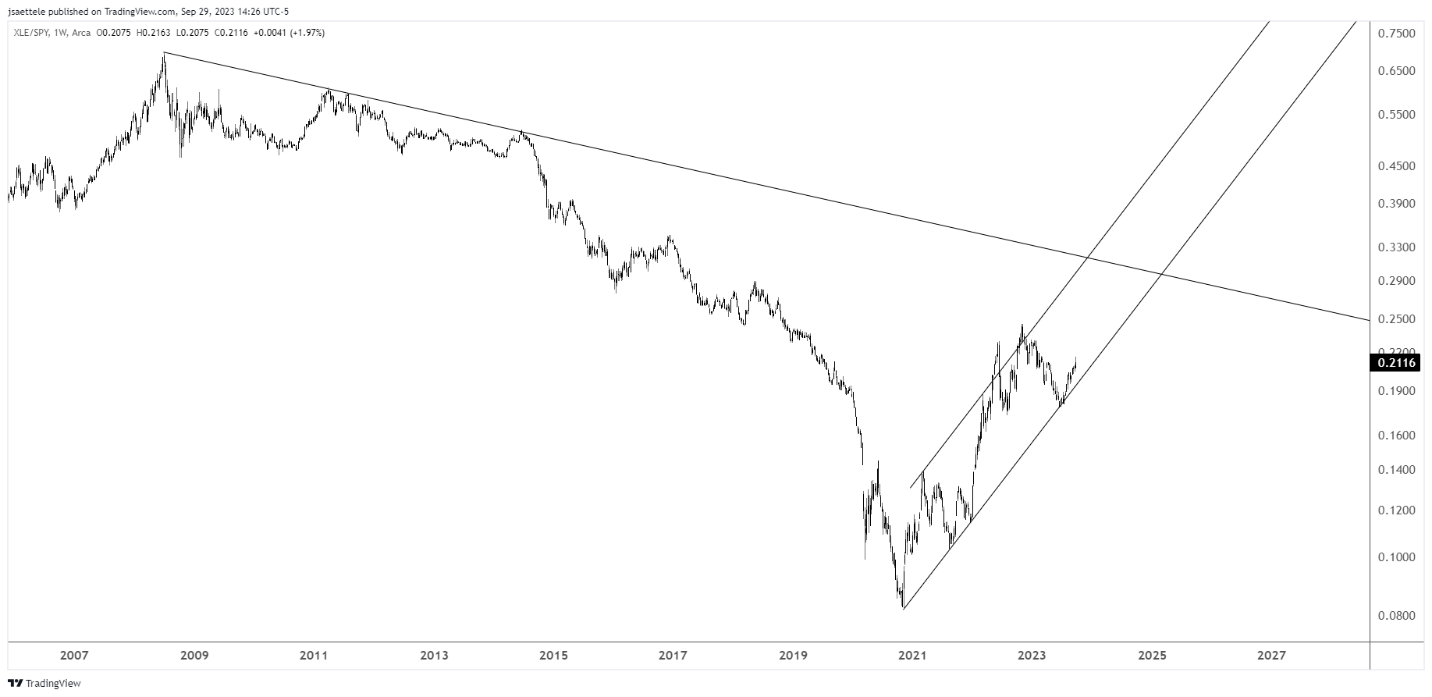
Currently, the XLE/SPY ratio from the chart below remains within a well-defined bullish channel and is therefore in a position to outperform. Using history as a guide, a final ‘emotional’ surge in the ratio will suggest that the U.S. economy has entered a recession.
Fixed Income Market
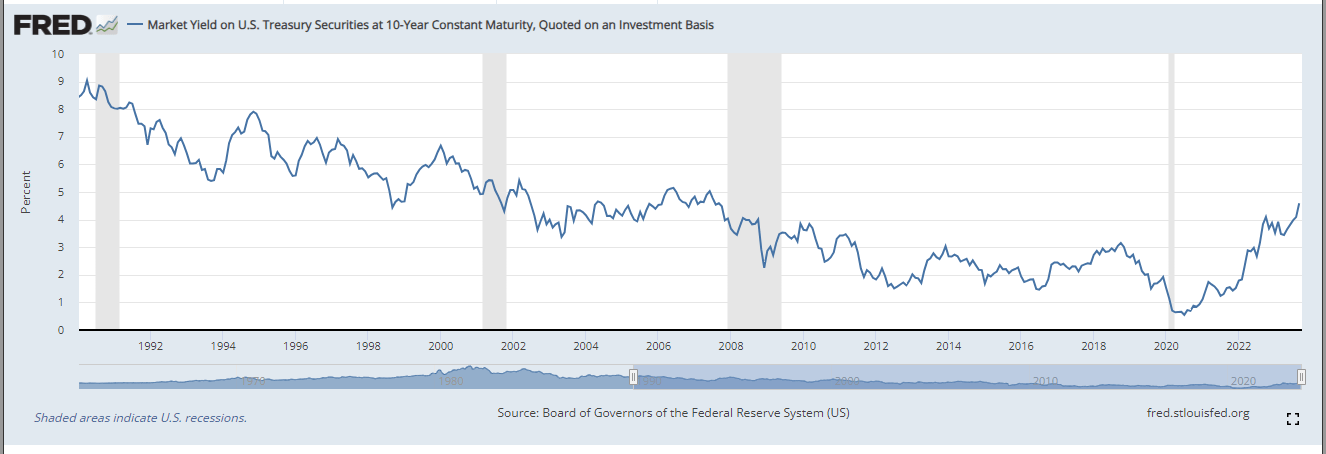
The hawkish tone from the Fed, balance sheet roll-off, stubborn inflation, and another potential government shutdown standoff are setting up a volatile quarter for the fixed-income markets. Volatility does not correlate to significantly higher rates in our opinion. We could see rates keep pushing incrementally higher before a quick retreat as we believe these levels of yields are attractive to fixed-income investors. Bond yields and prices move inversely so as demand increases for treasury bonds and investors purchase, yields subsequently go down. Our outlook remains positive on the bond market for long-term investors. We believe the likelihood of seeing the 10-year Treasury yield dropping to 3% is far more likely than seeing it yield 7%. The chart below shows the 10-year Treasury Yield is hitting its highest level since 2007[16].
Investors who searched for yield in the previous cycle needed to reach further out on the maturity schedule and/or down the credit spectrum no longer face the same challenges. We do take the Federal Reserve at its word when saying “higher for longer”; but their timeframe is much shorter than our investment horizon. The dot plot from the last FOMC meeting indicated the expectation for two rate cuts next year. We invest with a multi-year horizon, and we believe that rates will be lower for longer, from a secular perspective. There still remains the secular theme of the Three-D’s that should put long-term, downward pressure on rates:
- Demographics: The United States, and the majority of the globe, has an aging demographic. As this trend continues the demand for fixed-income instruments is likely to increase.
- Debt: The levels of national debt and higher rates are not in harmony.
- Disruptive Technology: Disruptive technology has enhanced productivity for decades and has been deflationary. In the case of generative artificial intelligence, the potential for the next leap forward in productivity could be around the corner.
Conclusion
Market sentiment has reversed significantly and is overly bearish; coupled with a stabilizing earnings outlook at an acceptable valuation is a recipe for potential market strength in the fourth quarter. There will be a recession at some point, but like everyone else, we don’t know when. For investors, this means sticking to thoughtfully developed target allocations. We believe this is not a market for taking excessive risk and having an allocation that aligns with your desired risk level can help alleviate short-term stress around bouts of volatility. We believe implementing a dynamic rebalancing program can assist clients in price improvement during short-term drawdowns by purchasing assets that are underappreciated and present long-term investment opportunities. Target allocations should also include broad diversification, when market themes shift, whether it be sentiment, style, or market capitalization) they have historically occurred quickly with little warning. Maintaining broad exposure allows investors to capture the “easy money” and not be overexposed to the newly out-of-favor theme.
At Krilogy®, we are committed to helping you effectively navigate the ever-changing market environment. As long-term investors, we believe it is critical to remain patient and stick to the plan that was developed for your unique situation to arrive at a personal allocation target. Our entire team remains dedicated to helping you achieve your financial goals.
Sources:
[1] Yardeni Research, Inc; https://www.yardeni.com/pub/stmktreturns.pdf
[2] Board of Governors of the Federal Reserve System (US), Market Yield on U.S. Treasury Securities at 10-Year Constant Maturity, Quoted on an Investment Basis [DGS10], retrieved from FRED, Federal Reserve Bank of St. Louis; https://fred.stlouisfed.org/series/DGS10, October 1, 2023
[3] U.S. Bureau of Labor Statistics, Consumer Price Index for All Urban Consumers: All Items in U.S. City Average [CPIAUCSL], retrieved from FRED, Federal Reserve Bank of St. Louis; https://fred.stlouisfed.org/series/CPIAUCSL, October 1, 2023
[4] CNBC; https://www.cnbc.com/2023/09/20/fed-rate-decision-september-2023-.html
[5] CNBC; https://www.cnbc.com/2023/09/20/fed-signals-it-will-raise-rates-one-more-time-this-year-before-it-ends-hiking-campaign.html
[6] LSEG I/B/E/S; https://lipperalpha.refinitiv.com/wp-content/uploads/2023/09/TRPR_82221_717.pdf
[7] KPS Research; data compiled from https://finance.yahoo.com/ and Morningstar Direct
[8] KPS Research; Trading View
[9] Factset; https://insight.factset.com/sp-500-reporting-a-lower-year-over-year-net-profit-margin-for-the-6th-straight-quarter#:~:text=The%20(blended)%20net%20profit%20margin,%2Dyear%20average%20(11.4%25).
[10] DQYDJ; https://dqydj.com/sp-500-profit-margin/
[11]Bank of American Merrill Lynch. (2017). The Most Contrarian Theme: Long-Term, Fundamental Investing. http://csinvesting.org/wp-content/uploads/2017/03/Fundamental-investing-and-the-long-term.pdf
[12] LSEG I/B/E/S; https://lipperalpha.refinitiv.com/wp-content/uploads/2023/09/TRPR_82221_717.pdf
[13] Forbes; https://www.forbes.com/sites/anthonytellez/2023/03/08/what-to-know-about-the-yield-curve-and-why-it-may-predict-a-recession/?sh=3be03443653c
[14] KPS Research; TradingView
[15] KPS Research; TradingView
[16] Board of Governors of the Federal Reserve System (US), Market Yield on U.S. Treasury Securities at 10-Year Constant Maturity, Quoted on an Investment Basis [DGS10], retrieved from FRED, Federal Reserve Bank of St. Louis; https://fred.stlouisfed.org/series/DGS10, September 30, 2023
Important Disclosures
Investment Advisory Services offered through Krilogy®, an SEC Registered Investment Advisor. Please review all prospectuses and Krilogy’s Form ADV 2A carefully prior to investing. This is neither an offer to sell nor a solicitation of an offer to buy the securities described herein. An offering is made only by a prospectus to individuals who meet minimum suitability requirements.
All expressions of opinion are subject to change. This information is distributed for educational purposes only, and it is not to be construed as an offer, solicitation, recommendation, or endorsement of any particular security, products, or services.
Diversification does not eliminate the risk of market loss. Investments involve risk and unless otherwise stated, are not guaranteed. Investors should understand the risks involved of owning investments, including interest rate risk, credit risk and market risk. Investment risks include loss of principal and fluctuating value. There is no guarantee an investing strategy will be successful. Past performance is not a guarantee of future results. Indices are not available for direct investment; therefore, their performance does not reflect the expenses associated with the management of an actual portfolio. The S&P data is provided by Standard & Poor’s Index Services Group.
Services and products offered through Krilogy® are not insured and may lose value. Be sure to first consult with a qualified financial advisor and/or tax professional before implementing any strategy discussed herein.