Click to download the PDF
Q4 2023 Review
Going into the fourth quarter we made note of the low sentiment readings and fear in the market. We believed that a contrarian view was more than likely to play out due to these factors. The bearish sentiment led to a tough October for the stock market with the S&P 500 falling to 4,100. Treasury yields spiked and the 10-year Treasury Yield pushed over 5% intraday on October 19. This downtrend was short-lived and the markets finished the year in strong form and the 10-year yield fell 1.12% to finish the year at 3.88%.
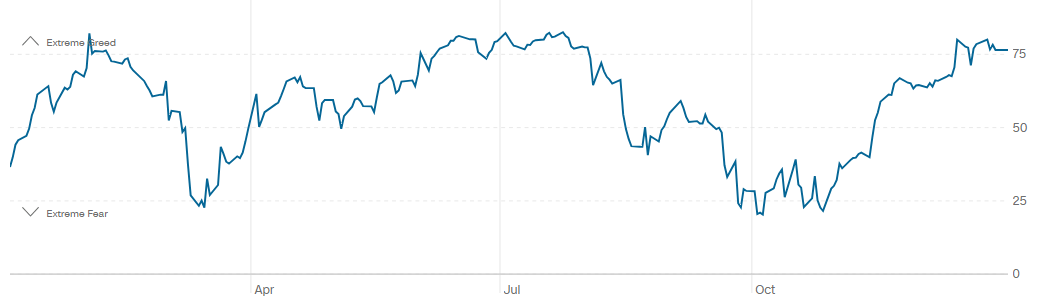
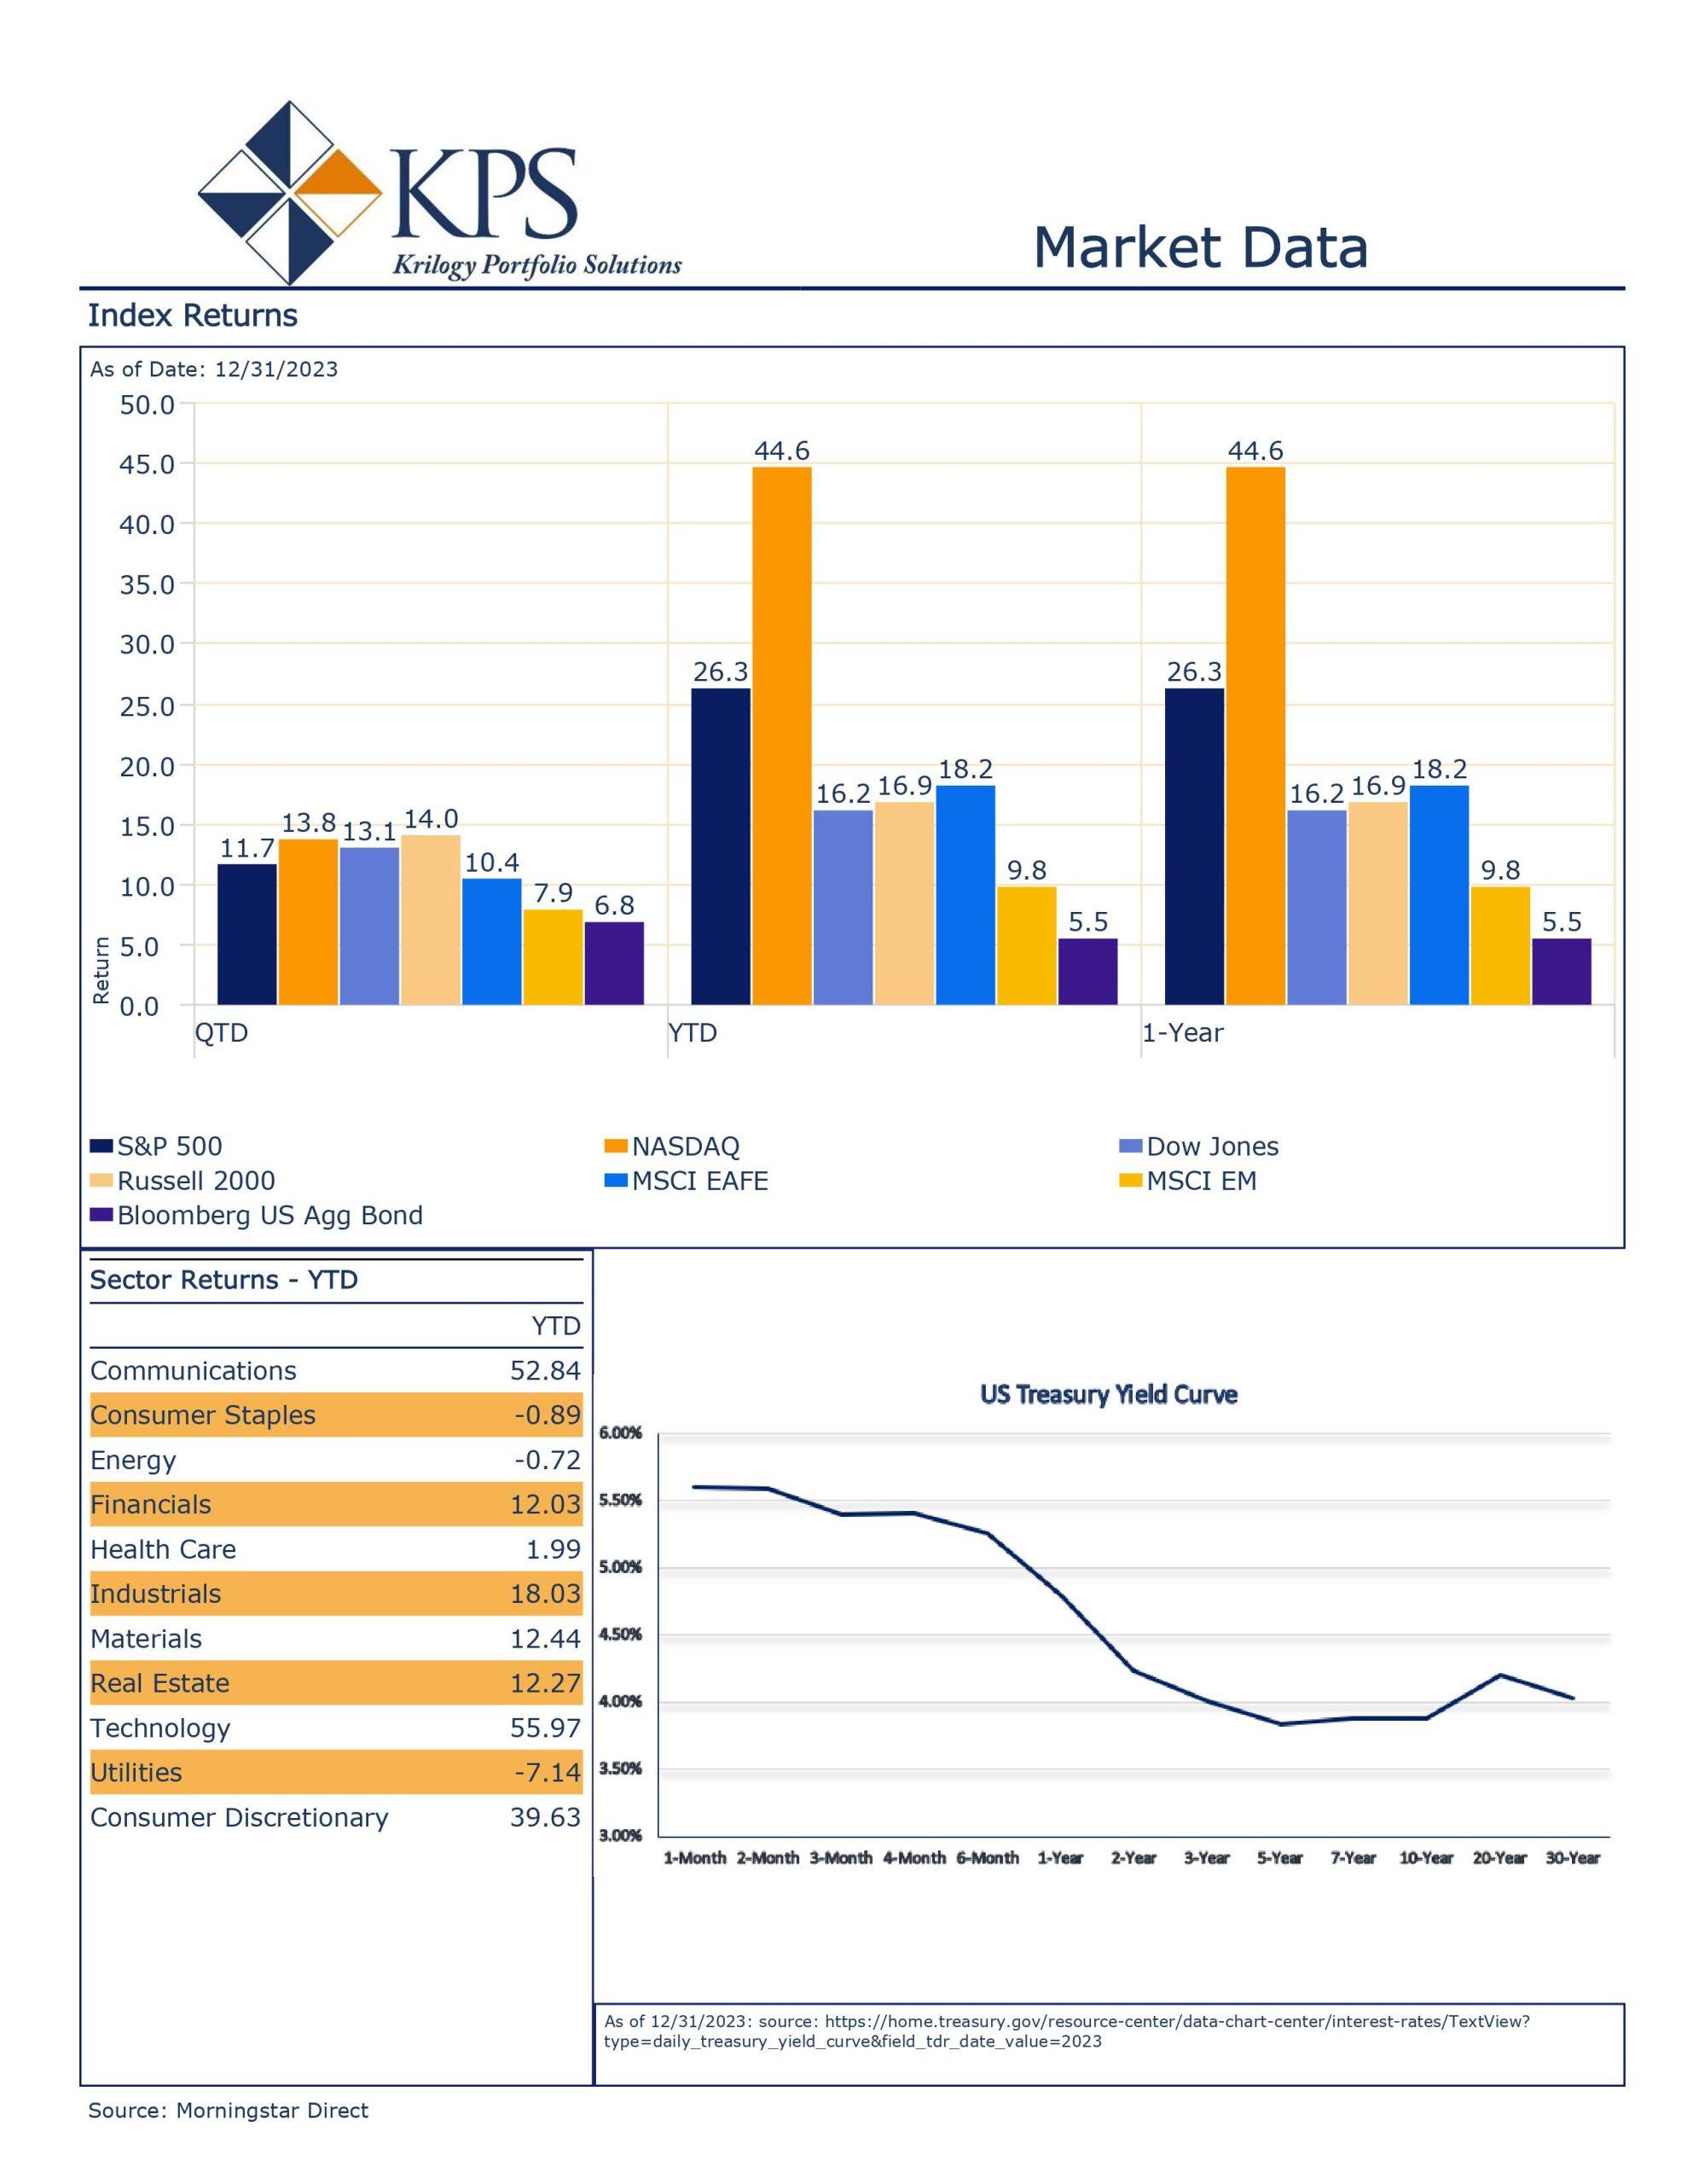
Market breadth has been weak all year, with the majority of the market gains concentrated amongst a handful of mega-cap technology companies. 62.2% of the S&P 500 return for 2023 came from the “Magnificent Seven”[1]. As market sentiment improved, which can be seen in the CNN Fear & Greed Index to the right[2], the market saw breadth improve and participation broaden significantly. The Russell 2000, which represents small capitalization companies, was the top performer for the quarter with a 14% gain[3]. The S&P 500 was up 11.7% and the NASDAQ finished the quarter up 13.8%. Despite the end-of-year rally, the year-to-date disparity between styles and market capitalization ended little changed. The NASDAQ led the way for 2023 with a 44.6% return. Large Cap Growth finished the year up 41.31%; closing a strong year relative to Large Cap Value returning 11.46%[4].
Early in the quarter, the bond market experienced a deep sell-off with treasury yields reaching their highest level in over a decade. Despite early weakness, bonds finished the quarter positive with the Bloomberg US Aggregate Index up 6.8% and finishing the year in the green by 5.5%.
The economy continued to show resilience in the face of higher rates and recession concerns. Third quarter GDP grew 4.9% year-over-year, improving from the 2.1% growth rate in the second quarter. The current estimate for fourth-quarter GDP growth stands at 2.3% according to the Atlanta Fed’s GDPNow[5] and full-year 2023 growth is estimated to be 2.4%[6]. The labor market has started to see some softening but remains strong relative to history. The unemployment rate has remained near the 3.5% level for the entirety of the year, reaching a peak of 3.9% in October. Inflation also continued to cool in the final quarter of the year. Core PCE, which excludes food and energy, was only up 3.2% in November on an annualized basis, and up a mere 0.1% for the month. The headline PCE reading actually fell 0.1% in November and rose 2.6% from the previous year. A very important figure from the most recent PCE report is that Core PCE rose at an annualized pace of 1.9% on a six-month basis. This statistic shows that the recent trend of inflation is approaching the 2% target of policymakers.
Q1 2024 Outlook
Equity Market
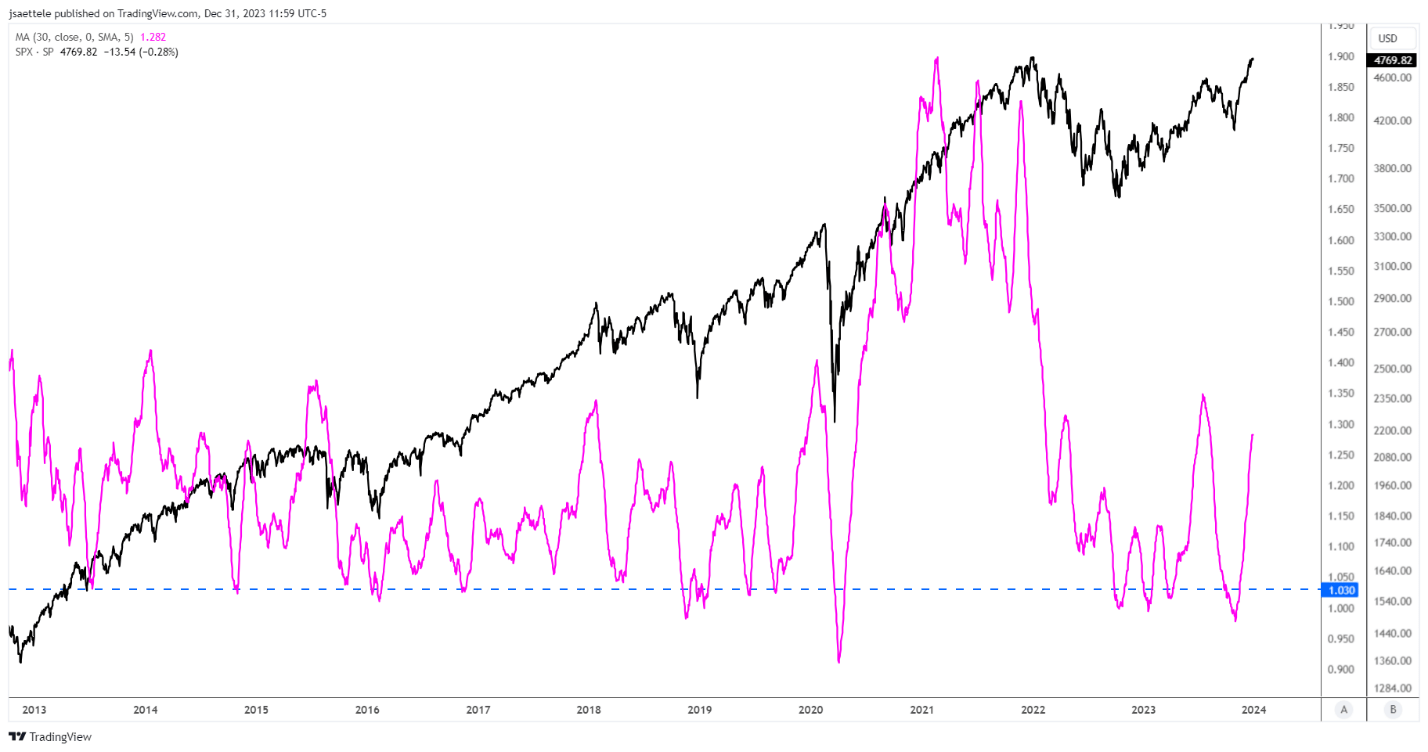
Unlike heading into the previous quarter, sentiment is no longer a tailwind in the short term. The below chart shows the 30-day average inverse of the CBOE Put/Call Ratio in magenta with the S&P 500 in black[7].
This ratio can be used to identify the level of fear in the markets. When the magenta line moves higher the amount of fear in the markets is reduced. As the line approaches the lower bound, as it did to start the fourth quarter, fear in the market is elevated thus being a contrarian tailwind for a market rally.
Sentiment is elevated across other indicators as well. The National Association of Active Investment Managers Index is above 100 and at its highest level since November 2021[8]. These indicators do not suggest a bearish view, but merely that sentiment is no longer a tailwind as we move into the new year and heightened volatility could occur in the near term.
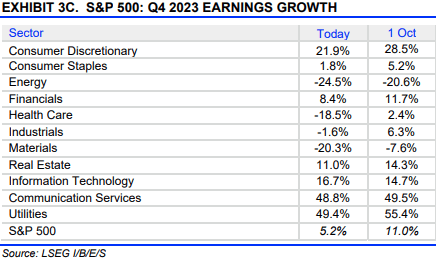
Fundamentals have continued to surprise analysts. Earnings results during the quarter handily beat analysts’ estimates. On October 1, expectations were for earnings to grow at 1.6%, actual results came in at 7.5%[9]. Analysts’ outlook for the entire year have been pessimistic and that trend has continued to the new year, despite companies showing resilience and beating their expectations. The slowing in earnings has continued to be pushed out on the calendar as seen in the data below from Lipper Alpha Refinitiv6. The earnings season which kicks off next week has seen a 50% reduction in earnings growth from October 1 and earnings growth for Q1 2024 has had a 22% reduction.
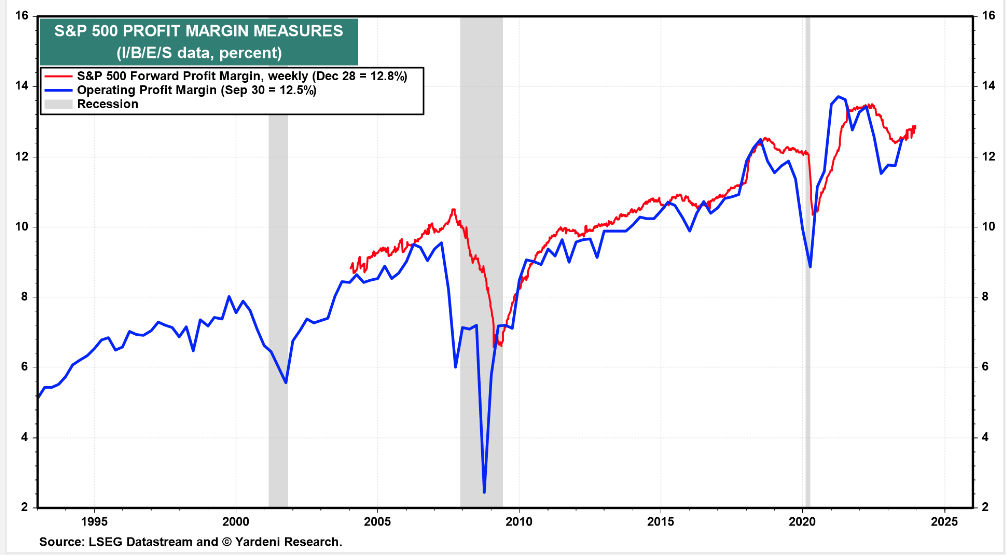
Companies thus far have shown resilience in navigating the recent restrictive environment by cutting costs and passing on a portion of input cost increases to consumers to maintain their profit margins. Profit margins were at historic highs coming out of the liquidity-filled pandemic recession. Surprisingly, the S&P 500 profit margin improved last quarter, and many are expecting this trend to continue. Although margins have experienced some contraction, they remain near historical levels as seen in the chart below from Yardeni Research, Inc[10].
Throughout the year the consensus economic outlook has shifted dramatically. Going into 2023, the consensus was for a mild recession; which never happened. Recently the narrative has shifted and the “soft landing” outcome has become more popular. According to the National Association of Business Economists (NABE), 3 out of 4 economists believe recessionary probabilities are lower than 50%. NABE President and Chief U.S. Economist for Morgan Stanley, Ellen Zetner, made the below comments following the most recent survey in early December[11]:
“Fewer respondents than in the October 2023 Outlook survey expect a recession within the next 12 months, with more than three in four assigning a probability of 50% or less. While most respondents expect an uptick in the unemployment rate going forward, a majority anticipates that the rate will not exceed 5%.”
We do not sit on either side of the “soft” or “hard landing” camp. This is because the economy does not always correlate with the stock market. As long-term investors, we look at market fundamentals and risks. We do believe we are at risk for a degree of economic slowing. But, the extent is very hard to predict. The absolute level of rates and the speed at which the Fed raised is likely to cause some weakness, which we witnessed during the regional banking issues last March. Monetary policy has historically shown that effects lag actual policy action. We have moved into that historical timeframe and some of the impacts on starting to show up in the data.
When looking at the fundamentals, earnings growth may be challenged in the coming quarters. Recently, revenue results have been softening. This has been overshadowed by the strong earnings results. Stability in profit margins has been one of the key factors in the ability to continue to post strong earnings. This is something we believe should be watched closely. Compression in margins will likely lead to earnings misses. Currently, consensus estimates for 2024 earnings are 244[12]. We are trading at a forward Price-to-Earnings of 19.5x 2024 earnings. This is elevated but not an extreme level in our opinion. But, like sentiment, the current market valuation is not a tailwind for the markets. The forward multiple on the market has the ability for some expansion, but a sustainable market move higher is unlikely based on multiple expansion alone. Moving into the new year we are also observing the fixed income market for indicators in the equity market. Fed policy has had a significant influence on the equity markets over the last two years. First, during the rate hiking cycle and now during the pause/cutting phase. Members of the Federal Open Market Committee (FOMC) have yet to declare victory in the fight against inflation, but the data is pointing to them being finished raising rates. The Fed’s most recent dot plot from their December meeting showed that FOMC members see the potential for three rates this year with the first coming in the latter half of the year[13]. This is a large divergence from bond market participants who are predicting five total cuts and the first one in March according to the Fed Fund’s Futures Market[14]. The chart below from Bank of America shows the S&P 500 Sectors’ performance relative to the timing of the first rate cut[15].
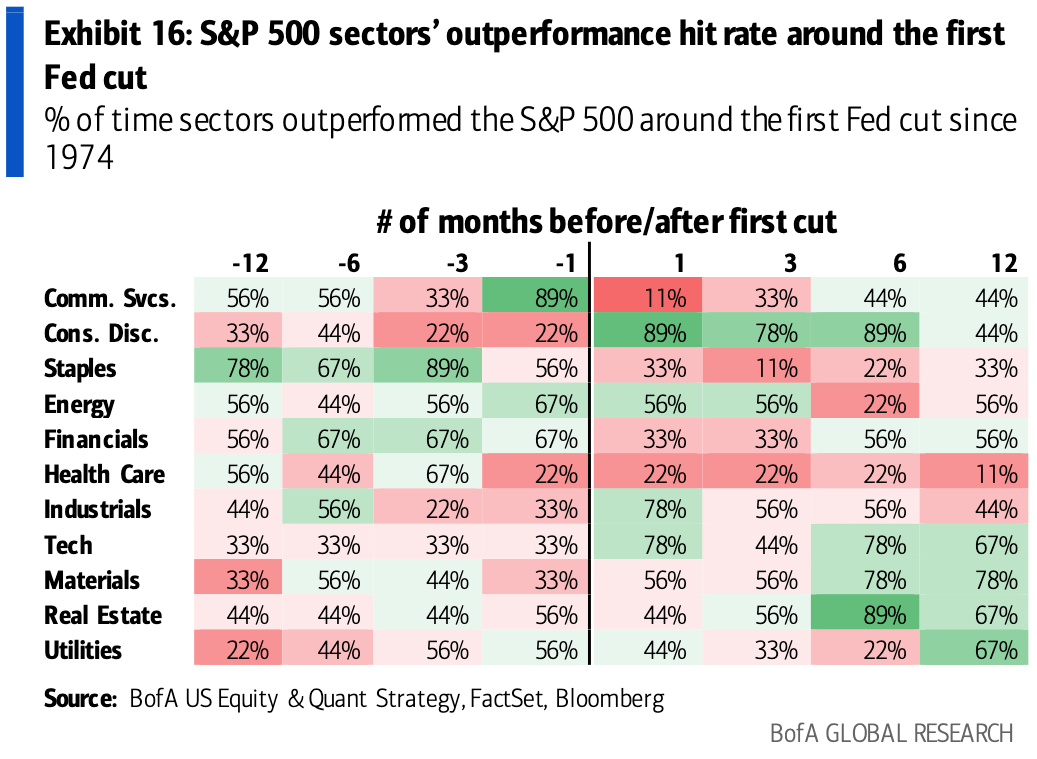
Regardless of when the first rate occurs, we are likely to see some weakness indicated by the sector outperformance in the BofA chart. The leading sectors three and six months before the first rate cut have historically been more defensive. These factors do not mean a market collapse but we believe investors should be aware of the potential for a slowing market heading into the first quarter.
Fixed Income Market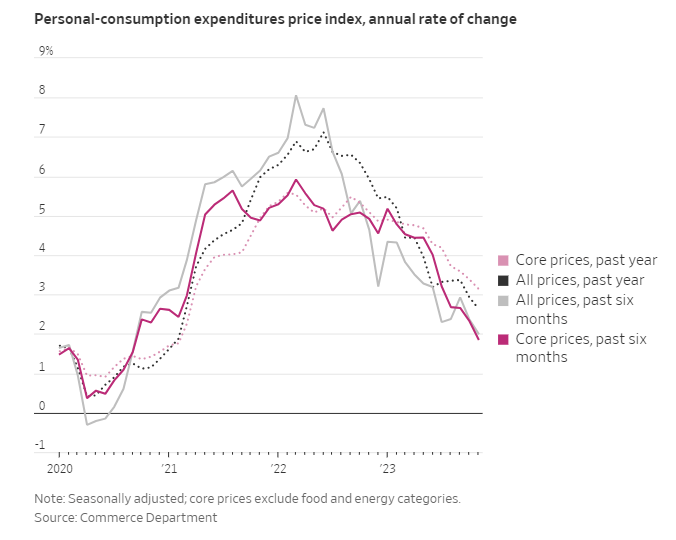
The 10-year Treasury yield experienced a volatile fourth quarter. It peaked, intraday, just above 5% before prices rallied and the yield finished the year 20% lower at 3.88%. The backdrop for rates leads us to believe that retesting the 5% level is unlikely. Inflation pressures have continued to moderate and a softening trend, albeit slowly, in the labor market. The chart to the right shows the rapid ascent, followed by the rapid descent in Core PCE, which is the preferred inflation gauge for policymakers[16]. The Fed raised rates at a historical pace during this hiking cycle but has held steady since their July meeting. Fed Chairman Powell has reiterated their stance on being data dependent. The data has improved and we do believe the Fed will continue to hold rates where they are. Unlike the market, we take the Fed at its word concerning their higher for longer stance. Policymakers have remained data-dependent and believe they will do so on the way down as well. If the data weakens to the extent that the Fed has to rapidly cut rates it likely doesn’t bode well for the equity markets. In our view, the “soft landing” outcome will come to fruition if the Fed gradually cuts rates back to their target.
Despite the recent struggles for bond investors, we still have a positive long-term outlook for the fixed-income markets. A 4% yield on the 10-year Treasury still presents a suitable return for fixed-income-oriented investors. Volatility in the bond market will likely remain through the end of the current business cycle so we do believe investors will have the opportunity to purchase bonds above 4%, which present an attractive risk/return profile.
Conclusion
Following a recent string of low volatility, heading into the new year we believe investors should prepare themselves for the potential reemergence of volatility. The broad rally in the previous quarter could lead to a pullback in the near term. As long-term investors, we believe these are healthy resets and necessary for a sustainable market rally in the future. With that in mind, investors should remain disciplined and remain committed to their strategic allocations. 2022 was a year where all investors struggled and 2023 was a year where investors likely saw large deviations from what the major indices performed. The market’s current is constantly in motion and it favors assets at differing times, and these shifts occur with little to no warning. Thoughtful asset allocation and a dynamic rebalancing program not only reduce volatility but can help investors capture the market shifts as they take place.
At Krilogy®, we are committed to helping you effectively navigate the ever-changing market environment. As long-term investors, we believe it is critical to remain patient and stick to the plan that was developed for your unique situation to arrive at a personal allocation target. Our entire team remains dedicated to helping you achieve your financial goals.
Sources
[1] JH Investments; https://www.jhinvestments.com/weekly-market-recap#market-moving-news [2] CNN Business, Fear & Greed Index; https://www.cnn.com/markets/fear-and-greed [3] Morningstar Direct, KPS Research [4] J.P. Morgan Asset Management; https://am.jpmorgan.com/content/dam/jpm-am-aem/americas/us/en/insights/market-insights/wmr/weekly_market_recap.pdf [5] Federal Reserve Bank of Atlanta; https://www.atlantafed.org/-/media/documents/cqer/researchcq/gdpnow/RealGDPTrackingSlides.pdf [6] The Conference Board; https://www.conference-board.org/research/us-forecast#:~:text=While%20we%20forecast%20that%20real,in%20near%20potential%20at%201.7%25 [7] KPS Research; Trading View [8] National Association of Active Investment Managers (NAAIM); https://www.naaim.org/programs/naaim-exposure-index/ [9] LSEG I/B/E/S; https://lipperalpha.refinitiv.com/wp-content/uploads/2023/12/TRPR_82221_729.pdf [10] Yardeni Research, Inc. ; https://yardeni.com/charts/sp-500-forward-revenues-earnings-margins/ [11] Globest; https://www.globest.com/2023/12/05/forecasters-expect-1-gdp-in-foreseeable-future/?slreturn=20240002114221 [12] Yardeni Research, Inc. ; https://yardeni.com/charts/yri-earnings-outlook/ [13] CNBC; https://www.cnbc.com/2023/12/13/fed-interest-rate-decision-december-2023.html [14] CME Group; https://www.cmegroup.com/markets/interest-rates/cme-fedwatch-tool.html [15] Daily Chart Book; https://www.dailychartbook.com/p/dc-lite-31-58c [16] The Wall Street Journal; https://www.wsj.com/economy/what-to-watch-in-fridays-spending-report-inflation-closing-in-on-feds-target-0778037d?mod=economy_lead_story
Important Disclosures
Investment Advisory Services offered through Krilogy®, an SEC Registered Investment Advisor. Please review all prospectuses and Krilogy’s Form ADV 2A carefully prior to investing. This is neither an offer to sell nor a solicitation of an offer to buy the securities described herein. An offering is made only by a prospectus to individuals who meet minimum suitability requirements.
All expressions of opinion are subject to change. This information is distributed for educational purposes only, and it is not to be construed as an offer, solicitation, recommendation, or endorsement of any particular security, products, or services.
Diversification does not eliminate the risk of market loss. Investments involve risk and unless otherwise stated, are not guaranteed. Investors should understand the risks involved of owning investments, including interest rate risk, credit risk and market risk. Investment risks include loss of principal and fluctuating value. There is no guarantee an investing strategy will be successful. Past performance is not a guarantee of future results. Indices are not available for direct investment; therefore, their performance does not reflect the expenses associated with the management of an actual portfolio. The S&P data is provided by Standard & Poor’s Index Services Group.
Services and products offered through Krilogy® are not insured and may lose value. Be sure to first consult with a qualified financial advisor and/or tax professional before implementing any strategy discussed herein.