Click to View PDF
Q1 2024 Review
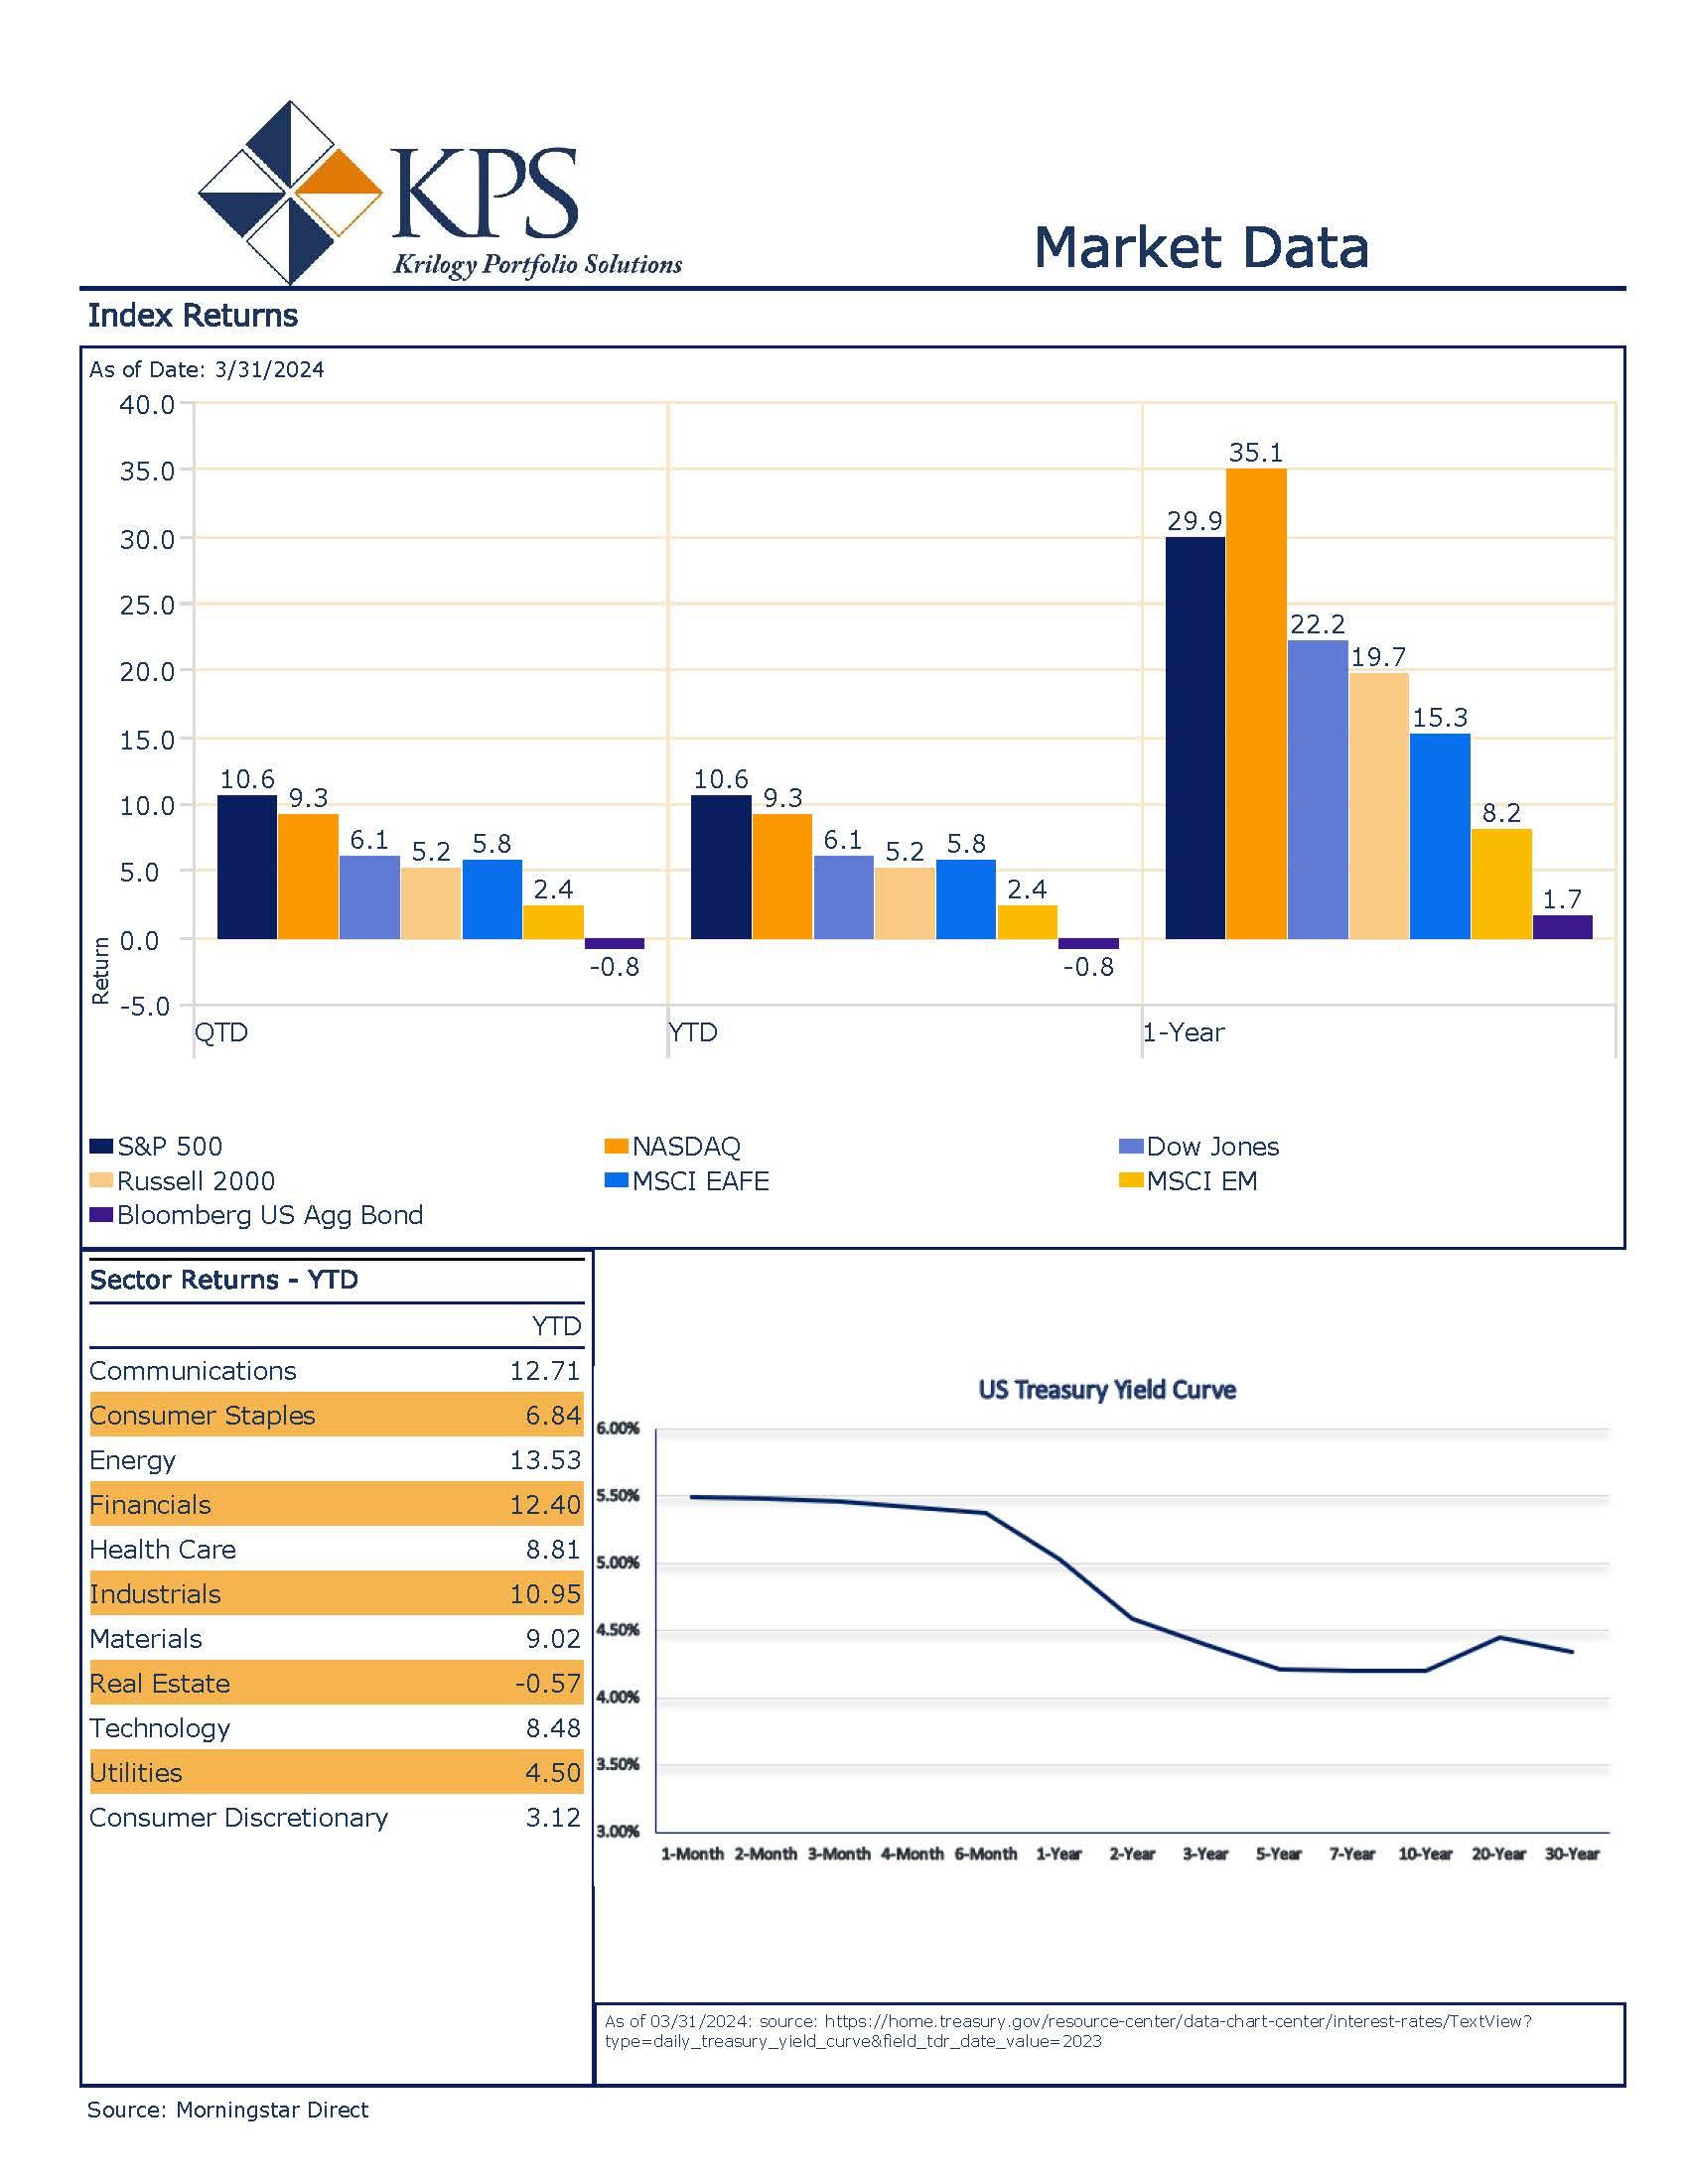
Following a year of narrow breadth in the market, where only a few companies in the S&P 500 drove the majority of the index’s return, the first quarter saw breadth expand. The S&P 500 finished the quarter up 10.56%, outpacing the NASDAQ’s 9.3% return[1]. The Russell 1000 Growth finished the quarter up 11.41%, continuing its leadership relative to its value counterpart which finished up 8.99%1. Over the previous year, growth has outperformed value by roughly 18% but, a shift towards value as of late has narrowed the gap that stood at 33% for 2023. Technology was the leading sector last year, but the first quarter was led by the Energy sector returning 13.53%. Close behind were Communications and Financials with returns of 12.71% and 12.40%, respectively. The lone sector to struggle in the first quarter was real estate, which ended the quarter down a modest 0.57%.
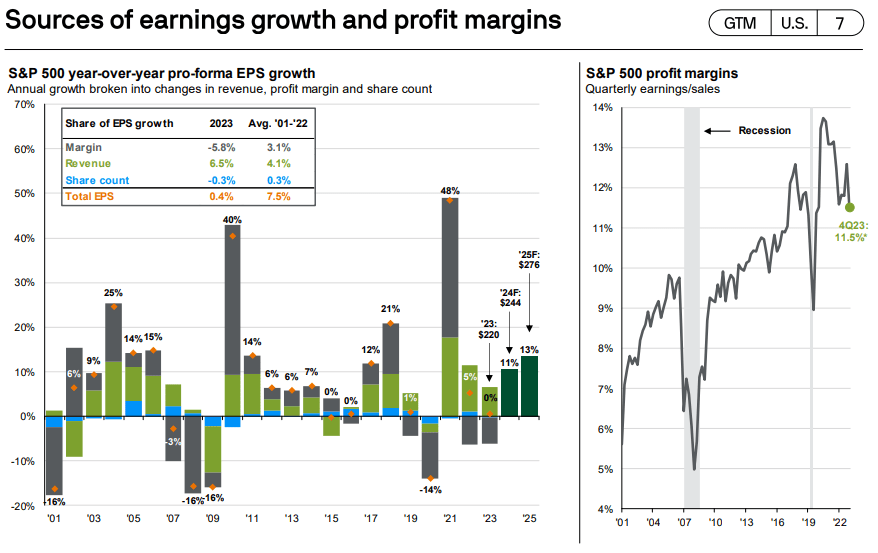
Once again, earnings results surprised the markets with the S&P 500 growing earnings by 7.5% year-over-year. Well above the 1.3% estimate on January 1[2]. For over a year, analysts have written down earnings expectations fearing that corporations will eventually feel the tighter economic environment following the rapid hikes by the Fed. Nimble maneuvering from corporate leadership has been able to navigate the environment and surprisingly kept their profit margins fairly stable from the last quarter to 11.5%[3], slightly above the 11% at the start of the year. The end-of-year strength in earnings helped the index avoid negative earnings growth year-over-year. The S&P 500 had marginal earnings growth in 2023 of 1.5%[4]. Full-year earnings growth was hurt by an annual compression in profit margins but sales remained stronger than expected as the consumer resilience was also a surprise to market analysts. The below table from JP Morgan Asset Management shows the contribution breakdown to earnings growth for 2023[5].
The bond market incurred a slight sell-off at the beginning of the quarter following a strong 3-month rally in the fourth quarter that saw yields drop over 1.2% from the peak in October. For the majority of the quarter volatility was low and yields remained relatively stable with the 10-year Treasury yield range bound in the 4-4.25% range. The 10-year Treasury yield finished the quarter at 4.20%, 0.32% from the previous quarter’s close of 3.88%.
The slight uptick in rates for the quarter was caused primarily by better-than-expected economic and labor market data. To start the year, there was a large disparity in market expectations to that of policymakers. Early in the quarter, the Fed Fund’s Futures Market had priced in as many as seven rate cuts, but as strong data came in from multiple fronts the market had to recalibrate its expectations, finishing the quarter with the expectation of only three cuts this year[6]. Policymakers remain committed to their 2% target and are data-dependent. GDP reports showed that the economy grew at an annual pace of 3.2% in the previous quarter despite the quantitative tightening efforts by the Fed. The labor market has slightly softened but remains historically strong. The economy created 303,000 jobs in March and the unemployment remains historically low at 3.8%.
Q2 2024 Outlook
Equity Market
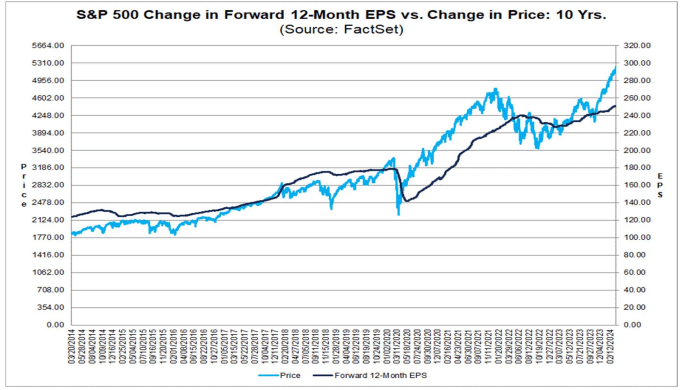
2023 saw relatively flat earnings, only growing 1.5%. This has led to the market multiple expanding despite the shaky economic backdrop and higher rates. To close out the quarter the S&P 500 traded at 21.6x forward four-quarter earnings[7]. While not at the extremes of the dot com bubble, the forward multiple is rich and poses a slight risk to markets going forward. The market is unlikely to continue a move higher based on multiple expansion alone. We will need to see earnings improvements, and if this occurs the market could trade near the current levels for a sustained period. Throughout the quarter, expected Q1 earnings moved in a wide range, but ended the quarter 5.1%7. This is still a downgrade from the 7.2% expected on January 1 and the 9.1% growth from October 1 but the good news is that we are seeing some stabilization. We believe that earnings and valuations are the main determinants of long-term stock expected return and performance. The chart on the next page from FactSet shows S&P earnings per share in dark blue with the S&P 500 Price in light blue3. There can be short periods of deviation but over the long run a sustainable move higher should accompany earnings growth.
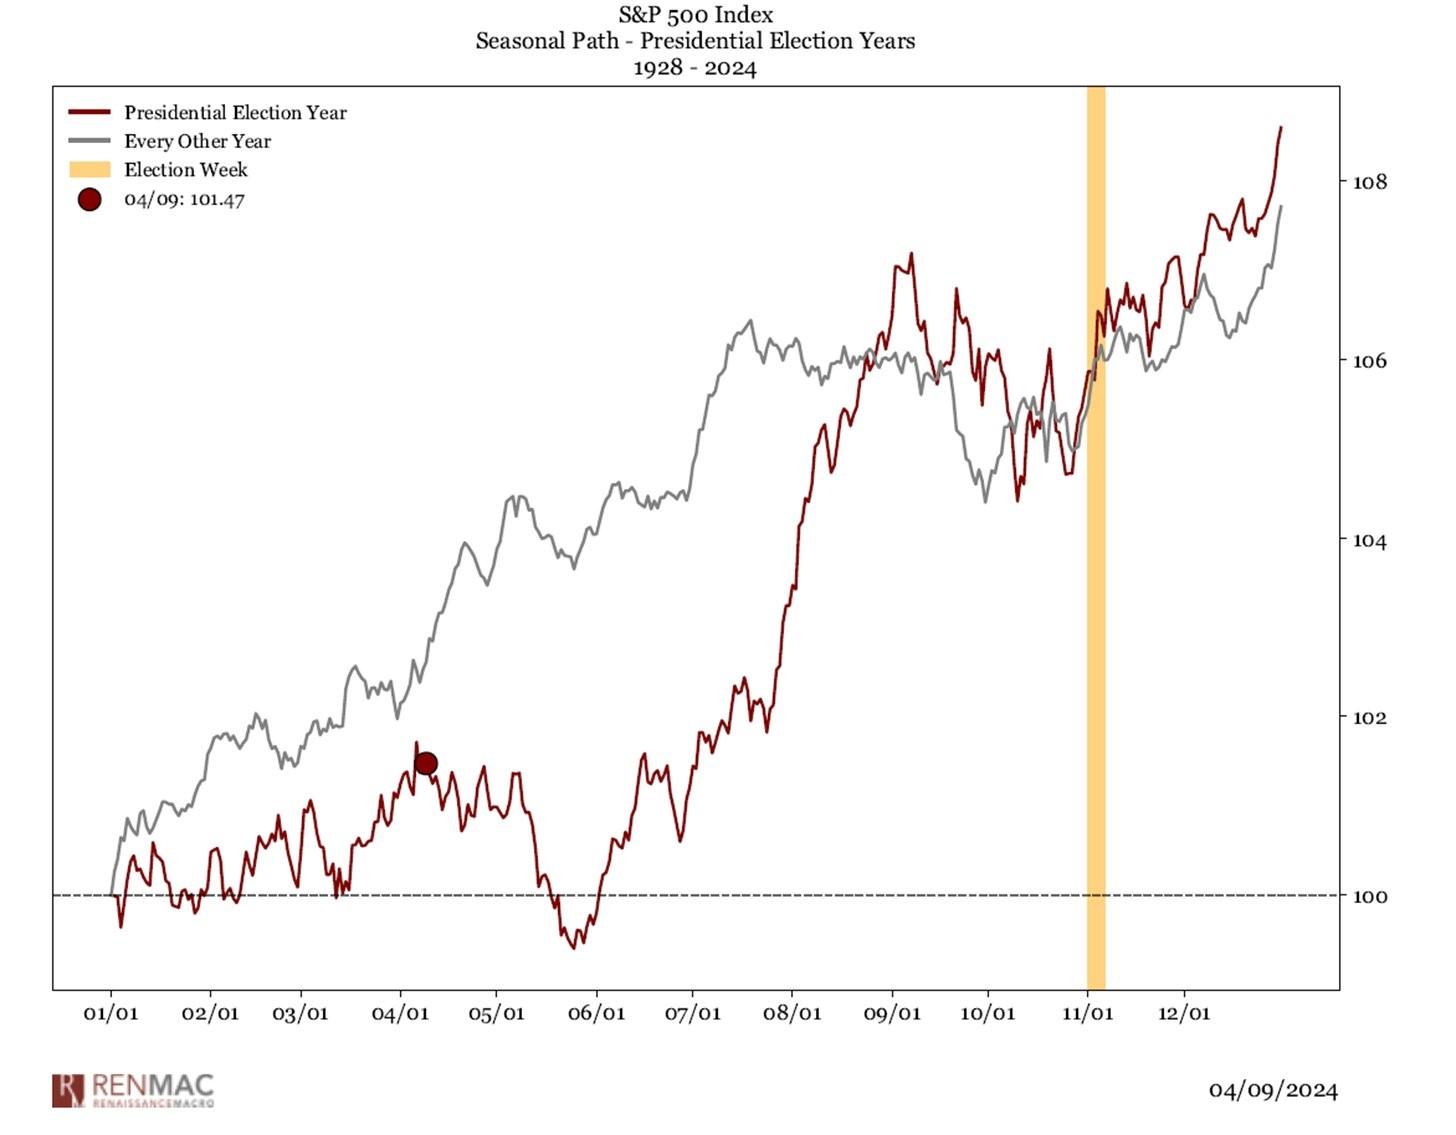
Over the past 12-18 months, the market has moved in close relation to seasonal trends, including the presidential election cycle. The seasonality axiom ‘Sell in May and go away’ is a common statement. Historically, this statement has validity with the return from November to April has outpaced the return from May to October[8]. For election years, the seasonality differs. The market tends to top in early April and pull back into late May. As can be seen from the chart below[9]. The potential risks for a correction are not just seasonal but also include elevated sentiment, geopolitical tensions, and the deterioration U.S. fiscal situation. Investors should also remember that markets do not move in straight lines. The largest drawdown in the first quarter was 2%. In 2023, the S&P 500 gained 24% and had pullbacks of 9% and nearly 11%. A cooling-off period can be healthy for the markets. Another healthy occurrence that occurred in the 1st quarter was the rotation into commodities. Crude oil and gold are beating the S&P 500 so far in 2024, rotation is a lifeblood of a bull market. The stealth rotation into energy and materials during Q1 may be a harbinger of things to come. Commodities are an area of the market we see showing strength in the near term, and would likely catch many market participants by surprise.
Fixed Income Market
The strength in the economy and labor market does give policymakers much latitude in future rate cuts. Fed Chairman Jerome Powell has not shifted his view that a loosening of policy too soon could lead to a reemergence of inflation and run the risk of having a longer impact on consumers[10]. The Federal Reserve also acknowledges the risks of remaining restrictive for too long. So far, they have been able to take policy actions without pushing the economy into a recession, so for now the “soft landing” remains a possibility. We believed going into the quarter that the markets were too optimistic on the number of rate cuts to take place this year, and until the Federal Reserve saw a trend in improving data would remain hawkish. Now, we believe the market is more aligned with the likely path of policy actions that will take place. We believe this should lead to a fixed-income market that stays range-bound until there is a sustained improvement in inflation data. Inflation has come a long way from its peak of 9% in June of 2022 but remains well above the 2% target. We anticipate the 10-year Treasury Yield to move between 4.25-4.75% over the next 3-6 months.
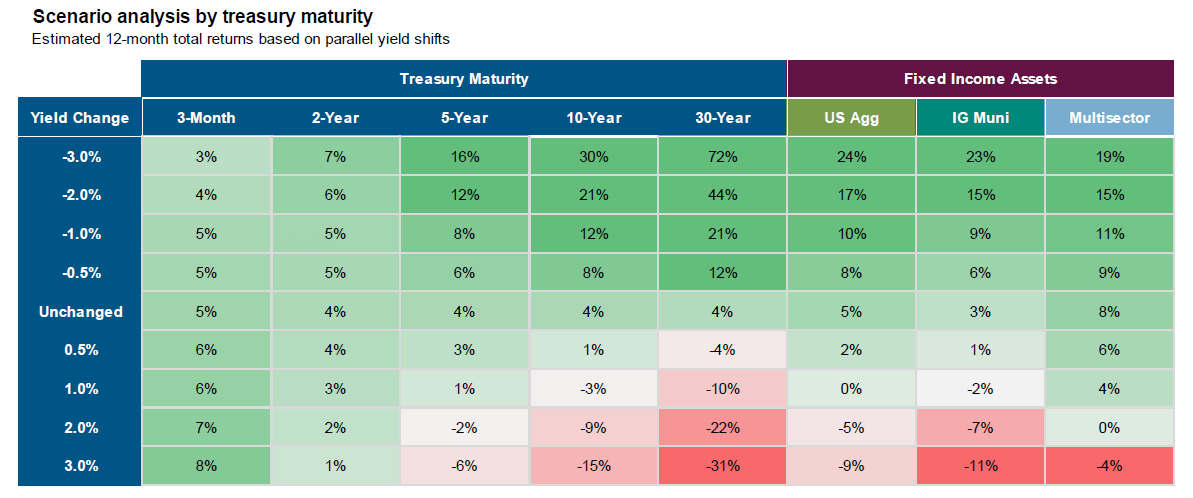
We still have a positive outlook on the fixed-income markets for long-term investors, but investors may need to recalibrate their expectations for what the future fixed-income market could look like. The multi-decade bond bull market was set up following run-away inflation in the 1970’s and historical bond rates in the early 1980’s. You could consider the previous bond market cycle as one of capital appreciation and less of the traditional income-driven total return. The “income” is back in fixed-income and investors should not sour on the asset class. Following a year like 2022, where bonds were down double digits it is understandable for investors to be wary. However, we see an asymmetric risk/reward profile for bonds. The below chart from PIMCO shows the expected return on bonds given various moves in interest rates that show this asymmetry[11].
Conclusion
The trend of low volatility continued into the first quarter of the year, and the market has rallied 10%. Some short-term risks do lie ahead that increase volatility and the market could see a pullback. We believe these pullbacks are healthy, and needed, for a bull market to continue moving higher. We do see areas of the market that are showing potential in the near term which supports our strong belief in commitment to strategic allocations. Market pivots can occur swiftly and are often unforeseen by most market participants. A thoughtfully developed strategic allocation, which aligns with your personal desired risk level and will help retain your long-term goals, along with a systematic rebalancing program can help alleviate worries during times of market weakness.
At Krilogy®, we are committed to helping you effectively navigate the ever-changing market environment. As long-term investors, we believe it is critical to remain patient and stick to the plan that was developed for your unique situation to arrive at a personal allocation target. Our entire team remains dedicated to helping you achieve your financial goals.
Sources
[1] KPS Research, Morningstar Direct
[2] FactSet Research, Inc., https://advantage.factset.com/hubfs/Website/Resources%20Section/Research%20Desk/Earnings%20Insight/EarningsInsight_010524.pdf
[3] FactSet Research, Inc. https://advantage.factset.com/hubfs/Website/Resources%20Section/Research%20Desk/Earnings%20Insight/EarningsInsight_032824.pdf
[4] Yardeni Research, Inc. https://yardeni.com/charts/yri-earnings-outlook/
[5] JP Morgan Asset Management. https://am.jpmorgan.com/content/dam/jpm-am-aem/global/en/insights/market-insights/guide-to-the-markets/MI-EAMU.pdf
[6] CME Group. https://www.cmegroup.com/markets/interest-rates/cme-fedwatch-tool.html
[7] LSEG I/B/E/S. https://lipperalpha.refinitiv.com/wp-content/uploads/2024/03/TRPR_82221_740.pdf
[8] Corporate Finance Institute. https://corporatefinanceinstitute.com/resources/career-map/sell-side/capital-markets/sell-in-may-and-go-away/#:~:text=Statistics%20and%20Considerations-,Historical%20data%20have%20generally%20supported%20the%20%E2%80%9CSell%20in%20May%20and,2%25%20between%20May%20and%20October.
[9] Renaissance Macro Research. Chart 04/09/2024. https://twitter.com/RenMacLLC/status/1777741174343606730
[10] CNBC. https://www.cnbc.com/2024/04/10/heres-why-the-federal-reserve-is-in-no-rush-to-cut-rates-in-2024.html#:~:text=%22Reducing%20policy%20restraint%20too%20soon,two%20percent%2C%22%20Powell%20said.
[11] PIMCO. Macro & Markets Presentation, January 2024.
Important Disclosures
Investment Advisory Services offered through Krilogy®, an SEC Registered Investment Advisor. Please review all prospectuses and Krilogy’s Form ADV 2A carefully prior to investing. This is neither an offer to sell nor a solicitation of an offer to buy the securities described herein. An offering is made only by a prospectus to individuals who meet minimum suitability requirements.
All expressions of opinion are subject to change. This information is distributed for educational purposes only, and it is not to be construed as an offer, solicitation, recommendation, or endorsement of any particular security, products, or services.
Diversification does not eliminate the risk of market loss. Investments involve risk and unless otherwise stated, are not guaranteed. Investors should understand the risks involved of owning investments, including interest rate risk, credit risk and market risk. Investment risks include loss of principal and fluctuating value. There is no guarantee an investing strategy will be successful. Past performance is not a guarantee of future results. Indices are not available for direct investment; therefore, their performance does not reflect the expenses associated with the management of an actual portfolio. The S&P data is provided by Standard & Poor’s Index Services Group.
Services and products offered through Krilogy® are not insured and may lose value. Be sure to first consult with a qualified financial advisor and/or tax professional before implementing any strategy discussed herein.