Soft Landing or Hard Impact?
Click to Download PDF
Inflation has been one of the primary risks to the broader US economy, and thereby the investment markets. In nine straight meetings, we have seen the Federal Open Market Committee act to slow down the economy by raising the Key Rate (the Federal Funds Rate) by 475 basis points. The Key Rate currently stands at 4.75-5.00%. Federal Reserve Chair Jerome Powell has maintained a Terminal Rate goal at 5.1%. We anticipate they will raise interest rates by another 25bps, likely their last raise in this cycle when they next meet in May. Accordingly, interest rates will have risen a full 5.00% in one year’s time.
The Federal Reserve’s objective towards managing inflation has been to slow down the US economy, which they saw as running overly hot, without driving it into a recession. Their stated aim is for a “soft landing,” which we can analogize to an airplane coming in for a smooth touchdown. However, if their actions have slowed down the economy too much, then the economy could fall into a severe recession. Accordingly, the airplane analogy would have the economy go into a stall and drop out of the sky.
The difficulty in managing inflation via rate hikes is that there is a laggard effect between the time interest rates are raised and when we can identify their direct manifestation in the broader economy. So far, we are beginning to see the Fed’s actions come into effect.
- In the First Quarter of this year, we can attest to the slowdown taking place as companies report their earnings per share (“EPS”). Specifically, we have seen a considerable share of companies, including and especially large caps, underperforming their EPS performance in the previous year’s quarter. Far more companies than normal have had their earnings contract. We can anticipate this continuing in the second quarter.
- Employment – a primary inflation indicator – is beginning to reflect macroeconomic tightening. The number of new job openings is contracting, and employee turnover is declining. This lessens the impact of wage growth, itself a major inflationary spur, as fewer companies have to compete for talent. Concurrently, major layoffs among high-wage employers have been increasing as companies decide to cut operational costs.
Signs like these indicate that we may achieve the “soft landing”. Whether or not the Fed’s actions will fully manifest as they intended will only be known in time. At the same time, major factors outside of the Fed’s control could independently drive the economy into a hard impact. We should keep our eyes on these factors as we enter the second quarter.
Banking Turmoil 2023
Traditional wisdom states the Fed will raise interest rates until something breaks. In the first quarter, we witnessed a fracturing in regional & specialized banking.
The Key Rate hikes over the past year have found a significant weakness in the traditionally conservative business model of banks. Their standard practice is to invest depositor cash into long-term Treasurys and mortgage-backed securities, recognizing stable interest income while the bank earns revenues from its loan portfolios. However, banks have been triply hit by inflation. First, their loan portfolios have significantly declined as interest rates have increased. The market for new home mortgages has severely contracted, and refinancing loans are largely gone. Second, the inverted yield curve – with short-term Treasurys yielding more than long-term Treasurys – has made banks’ investment portfolios minimally profitable. Finally, the elevated costs of borrowing cash from the Fed’s Overnight Window is now higher than the revenues recognized from their investments, leaving banks exceedingly vulnerable to depleting their capital reserves.
This has brought on evolving concerns of potential systemic risk within the banking industry, especially impacting smaller regional banks rather than the “too big to fail” banks. The first quarter witnessed the collapse of Signature Bank and Silicon Valley Bank in the US, when each experienced bank runs and were shuttered by their state regulators. Both banks were S&P 500 components at the time of their collapse. Meanwhile, in Europe, Credit Suisse was bought by UBS, who was compelled to buy the Swiss bank after it nearly collapsed under its own weight. The Federal Reserve, Federal Deposit Insurance Corporation, and the Treasury acted quickly to backstop US banks with additional capital and assistance as they sought to prevent more bank collapses. Still, it is apparent we have the potential for contagion risk within US banking.
We anticipate new government actions to protect the banks from themselves may contribute to economic contraction in the second quarter. These actions may include tighter standards among lenders, increased scrutiny, and increasing capital ratios. Generally, these actions will further slow economic activity. When these actions combine with high-interest rates — that could be raised even higher in May — the end result may well be a recession.
The Debt Ceiling Debate
The second quarter will include the impending debate over the US debt ceiling, and the total amount of national debt our country is legally allowed to amass. A law passed in 1917 limits the total amount of debt the United States may assume. Once this limit is hit, Congress has to raise this limit to a higher amount in order for the U.S. to continue to borrow and to meet our obligations, i.e., to pay our debts and ongoing obligations, without going into default.
Historically, raising the debt ceiling has been a standard legislative procedure. While there has always been a degree of partisan political gamesmanship, the consensus has always been that the risks of not raising the debt ceiling are too dangerous. No one wants to risk the full faith and credit of the United States being tarnished. Still, there has been a pattern in the past 30 years to make the debt ceiling a highly partisan issue, and in the process to not pass legislation raising the debt ceiling until we are standing on the proverbial cliff. Today, Washington is highly fractured, resulting in the strong likelihood that partisan politics will make the debt ceiling fight quite unpleasant.
Our economy faces a number of specific risks should there be a long and difficult fight on raising the debt ceiling. These include an increased likelihood of recession (an almost certainty if the debt ceiling is not passed), the further displacement of the US Dollar as the world’s reserve currency, the loss of crucial benefits to dependent Americans, including veterans losing medical care and seniors not receiving their social security checks, higher interest rates, even rising above what the Fed wants to see today, and failing public trust weakening the nation as a whole.
The United States has never defaulted on its debt. We shouldn’t expect it to do so this time. All the same, we can surely expect Washington to “play chicken” with the debt ceiling this quarter. No matter who blinks first, the country will feel the risk.
Fixed Income Markets
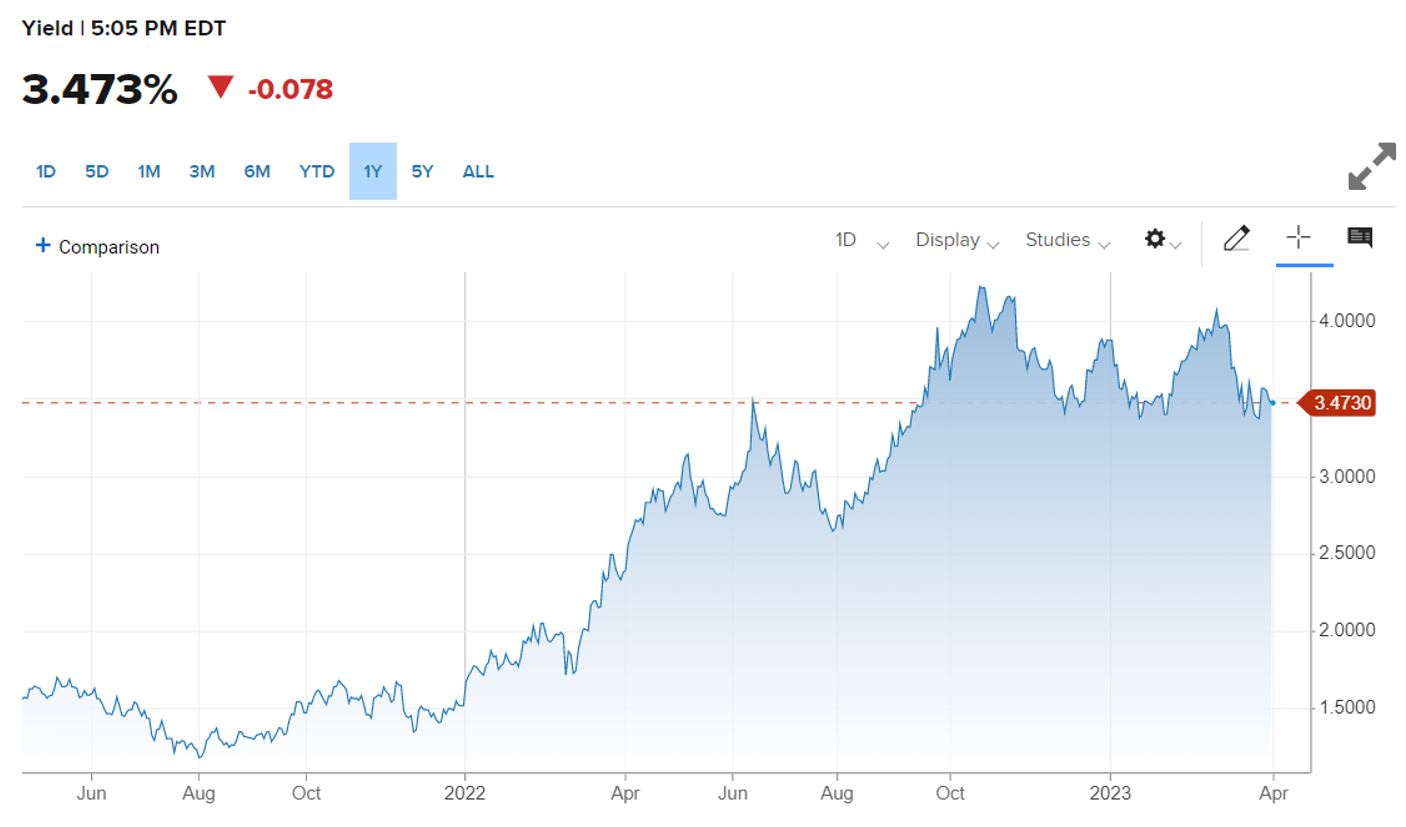
All eyes have been focused on the Fed since the beginning of the year as the market became convinced that the Fed would have to start easing. Many believed that a recession was looming as a result of its aggressive rate-increasing campaign and sent bond yields lower in January only to lose confidence in February and then reacquire it again in March. As the chart from CNBC below (www.cnbc.com) shows, the 10 yr. treasury bond began the year at 3.50%, rose to 4+%, then fell back to 3.5% where it began.
The old saying on Wall Street is “When the Fed is in the mood to raise rates it will keep doing so until something breaks.” Three major bank failures (Credit Suisse, SVB, and Signature Bank) fit the bill. So, the expectation in the market for Q2 and Q3 is a kinder gentler Fed continuing to raise rates in the short end of the curve, albeit at a slower pace. This could be constructive for the longer end, which in many ways is good for investors as the Income is back in fixed income after a prolonged period of artificially low rates.
Having said all that there are still a few storm clouds on the horizon. The health of the regional banking system, the Fed’s willingness to fight inflation at the cost of employment by continuing to raise rates, and the looming political fight over the debt ceiling, to name a few. Any one of these could upset the economic applecart and lead to contingent events that might cause a significant slowdown in the economy.
We are in the mild recession camp and believe it will occur sometime in the second half of the year. However, the severity remains unclear. Inflation numbers have rolled over and credit conditions are tightening. With that foremost in our minds, we expect rates to stay flat over the course of the year, finishing 2023 in the 3.25 to 3% range. No doubt there will be some opportunities to buy high 3 % yields along the way, but these events will be fleeting. Higher-than-average volatility remains the order of the day.
Fundamentals
Despite the volatility and uncertainty that dominated market sentiment in 2022, earnings remained strong through the first three quarters. The first signs of weakness by corporations following a historic rate hiking environment began to appear in the fourth quarter of 2022. Fourth quarter earnings declined 3.2% year-over-year1. The Energy Sector led the way again with quarterly earnings growth of 59% followed by industrials with 41% growth. These were the only two sectors of the eleven, that reported positive year-over-year growth.
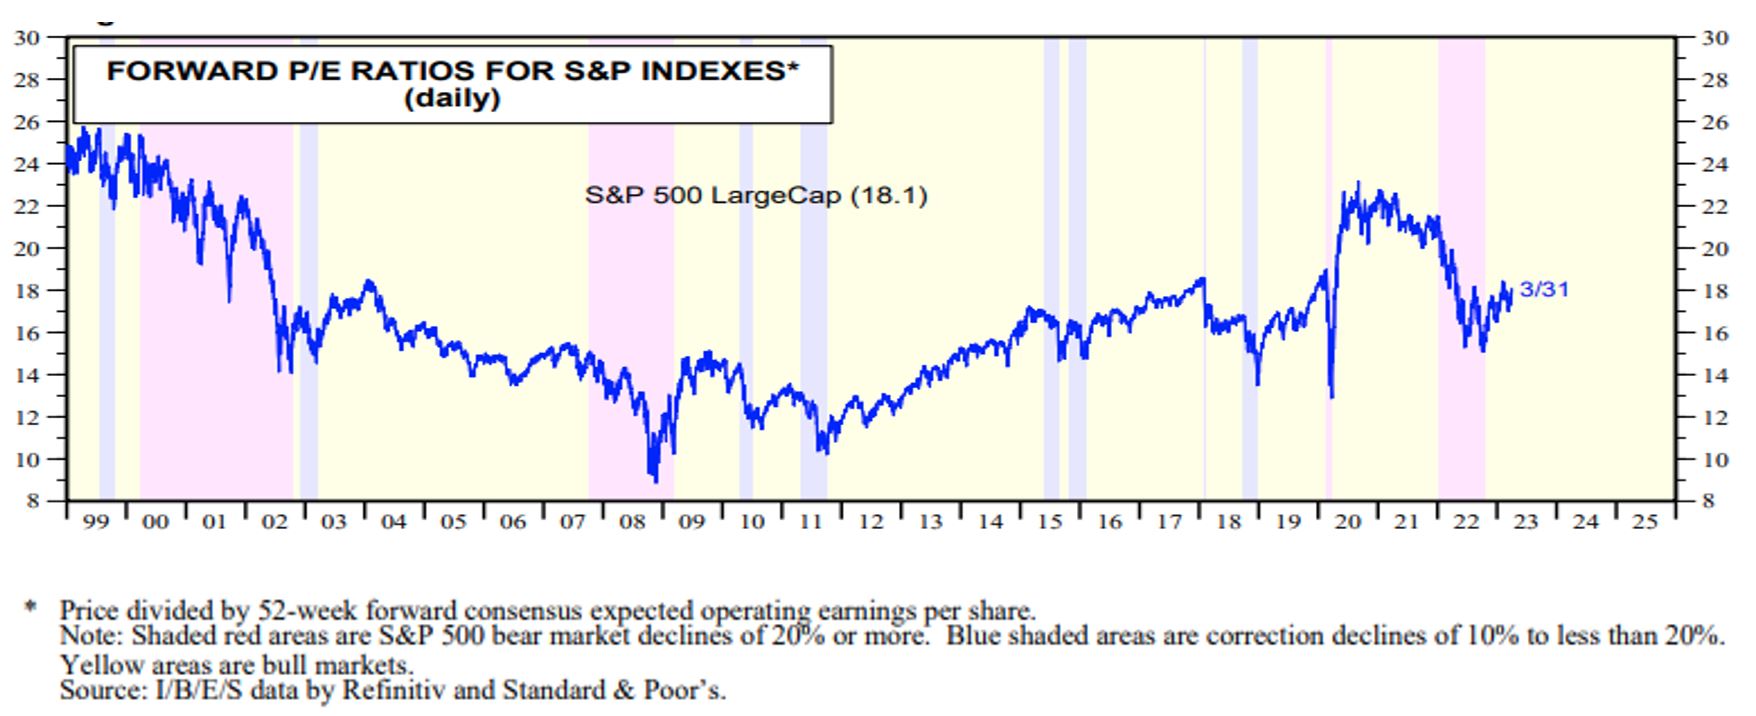
Earnings revisions accelerated in the first quarter, and estimates for 2023 have earnings growth at 1.2%. Notably, early January 2023 analysts’ estimates had earnings growth at 4.4% and on October 1st, 2022 annual earnings growth was expected to be 7.8%. The markets rallied in the first quarter, that was fueled by multiple expansion. Coming into the year, the S&P 500 was trading at 16.8 times 2023 earnings estimates, which is a reasonable valuation. At the end of the quarter, that multiple expanded to 18.6 times. Given the current level of rates, an 18 times multiple is elevated in our opinion and earnings will need to come in, at a minimum, as expected this quarter to see a significant move higher. It’s our belief that over the long run, earnings and valuation are the key factors that determine future returns. The chart below is the rolling forward P/E ratio for the S&P 5002.
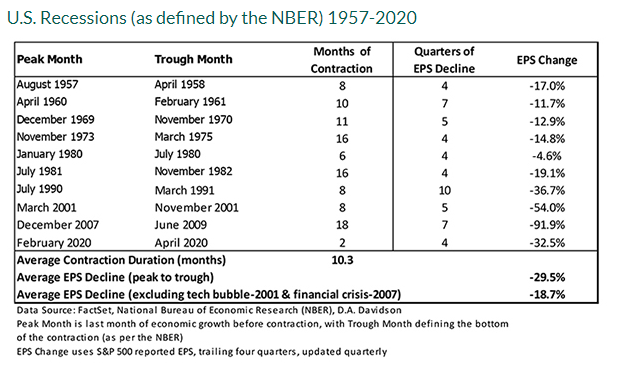
We believe further downward revisions are to come, but with the strength of the labor market, the health of the consumer, and strong balance sheets of the major banks (despite the recent weakness in the regional/smaller markets) earnings declines are going to be mild relative to previous slowdowns. The average earnings decline during a recession since 1957 has been -29.5%3.
As we enter the latter stages of earnings revisions and declines, we remind investors that the market is a discounting mechanism. In the face of challenges and headline noise, the market has the ability to look past the immediate. Historically the market began its rally before data (earnings and economic) troughed. From a bottom-up standpoint, we have a neutral view of the markets in the near to intermediate term. The 18 times multiple is not extremely elevated and to start the quarter the S&P 500 was still 15% below its all-time high of 4,818 from January last of last year. As earnings continue to weaken, we expect volatility to remain elevated, but if you have a multi-year investment horizon, equities still present attractive opportunities.
View from the Technical Analysis Lens
The S&P 500 just completed 2 consecutive quarters of at least 7% gains. That has never happened in a bear market before. The index finished March 17% off of its October low. The Nasdaq composite is over 20% off of its 2022 low. Yet, the term ‘bear market rally’ remains popular among market participants. On that front, the hedge fund long-short ratio is at multiyear lows; the Bank of America March Global Fund Manager Survey (FMS) bottom line highlight is “investor sentiment is close to levels of pessimism seen at lows of the past 20 years.”4. The same FMS survey reveals that investors are the most overweight cash and most underweight equities. According to the American Association of Individual Investors (AAII), Investors have never been this bearish for such a long time period. Deeply negative sentiment is reason enough to have a positive outlook on the market.
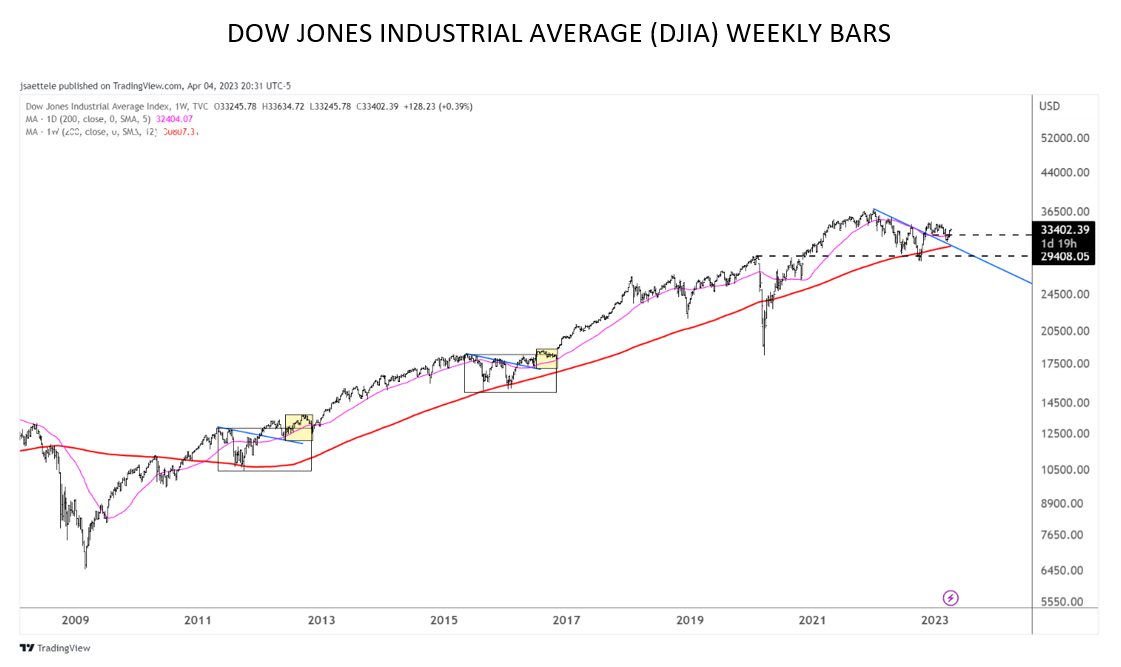
The price pattern in the Dow Jones Industrial Average (“DJIA”) since the October low is similar to price patterns from the 2011 and 2016 DJIA lows. In each case, the index held the 200-week average (red line), broke above the 200-day average (magenta line) and negative sloping trendline (blue lines), pulled back to test these metrics as support, and turned then higher. The yellow boxes in the previous chart highlight are what we expect in the current market environment. That is, the price should resume higher and exceed the December high. After that, we should expect another choppy pullback (similar to December 2022 – March 2023) before the strongest part of the rally takes place. The bottom line, the immediate implication from this comparative analysis is bullish.
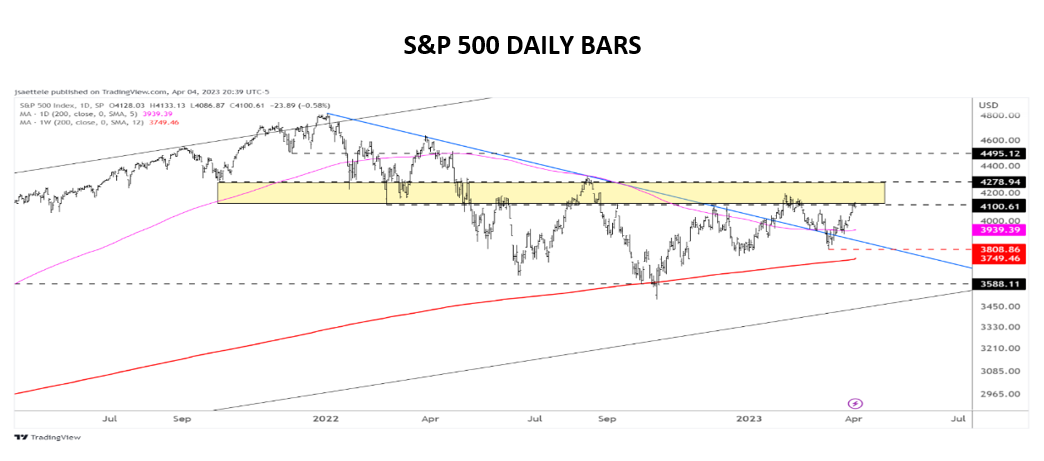
The S&P 500 is trading at an important juncture as the calendar turns to the second quarter. The 4100-4300 range is defined by market turning points over the last few years, including the February 22, 2022 low (Russian invades Ukraine), August 2022 high, and October 2021 low. Support and resistance exist because markets have a memory. The proximity of turning points in the S&P 500 establishes a battle zone of sorts for bulls and bears. Keep an eye on this zone because a push above would indicate that bulls have taken strong control of the environment.
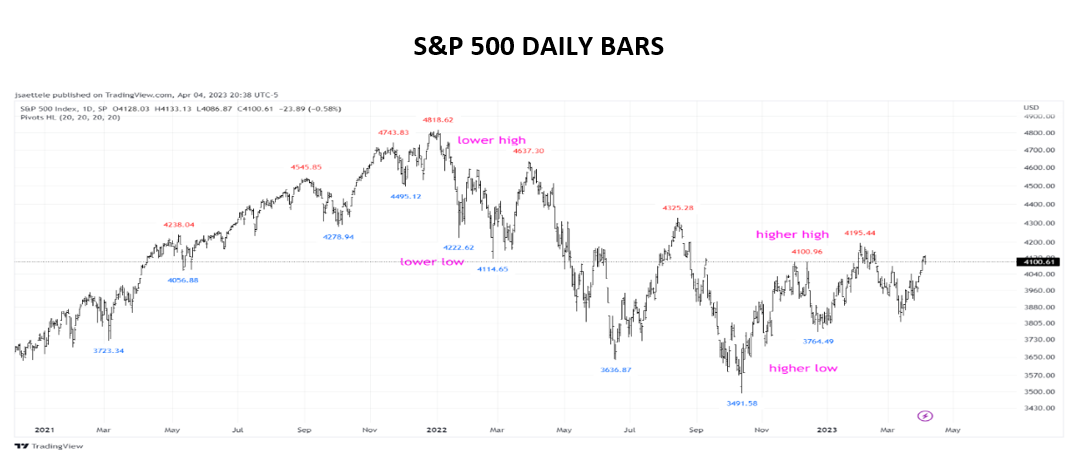
The chart below displays high and low pivots for the S&P 500 for the last two-plus years. Simply, a bullish trend is one in which the price establishes higher highs and higher lows. A bearish trend is one in which the price establishes lower lows and lower highs. Many concern themselves with information that has nothing to do with the market and forget these simple truths. The pivots are defined with a left and right strength of 20. This means that each high has 20 days to the left and the right. Each low also has 20 days to the left and to the right. Obviously, a pivot cannot be defined until 20 days after it is actually formed. This exercise isn’t meant to pinpoint timing, but rather define the environment based on the most basic yet important market data that exists-the market data itself. Bottom line, the S&P 500 now sports higher highs and higher lows based on the outlined definition for pivot highs and lows. As long as price stays above the March 13, 2023 low of 3808, another higher pivot low will form at that low on April 11, 2023. That level will then become the new ‘line in the sand’ for any tactical bullish position.
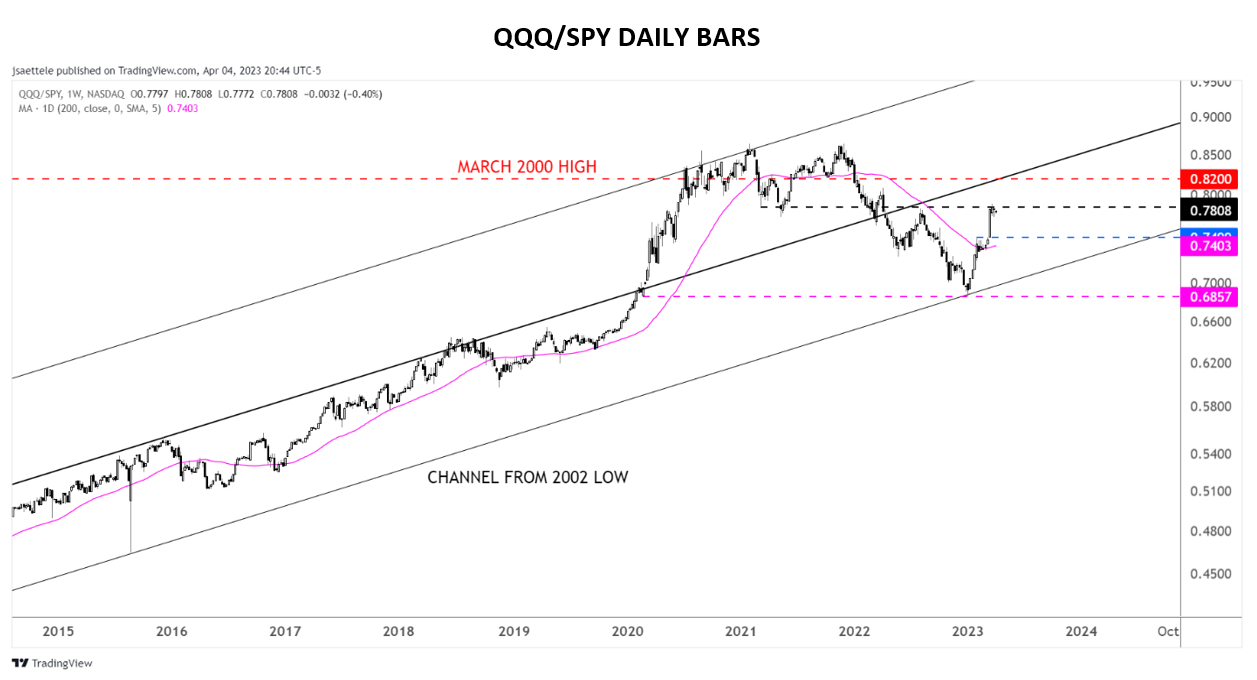
The QQQ/SPY ratio has been confined to a channel since 2002 low (a close-up is shown here). The ratio is up 15% (trough to peak) from the January low and just took out the August 2022 high. Recall that August was the top in 2022 prior to the final leg down into the October lows for most indices. This is a natural level for the ratio to pause its advance. In other words, don’t expect as much success this quarter with the first quarter 2023 playbook riding tech to outperformance (The first quarter started the day that the ratio was at the bottom of the channel).
1 Dhillon, Tajinder, CFA. “This Week in Earnings: Aggregate Estimates and Revisions.” LipperAlpha Refinitiv. 3/31/2023. https://lipperalpha.refinitiv.com/wp-content/uploads/2023/03/TRPR_82221_691.pdf
2 “Stock Market Briefing: Selected P/E Ratios”. Yardeni Research, Inc. 4/2/2023. https://www.yardeni.com/pub/stockmktperatio.pdf
3 Ragan, James, CFA. “What a Recession Means for Markets”. D.A. Davidson. 4/2/2023. https://dadavidson.com/News/Perspectives/ArticleID/3582/What-a-Recession-Means-for-Markets
4 Bloomberg, Bank of America Global Fund Manager Survey. https://www.bloomberg.com/news/articles/2023-02-14/bofa-survey-shows-investors-don-t-expect-the-stock-rally-to-last#xj4y7vzkg
Important Disclosures
Information contained in this document is provided by an independent third party, Ned Davis Research. While believed to be accurate, Krilogy® has not independently confirmed each piece of information.
Investment Advisory Services offered through Krilogy®, an SEC Registered Investment Advisor. Please review Krilogy’s Form ADV 2A carefully prior to investing. All expressions of opinion are subject to change. This information is distributed for educational purposes only. It should not be construed as individualized advice or recommendations suitable for the reader.
Diversification does not eliminate the risk of market loss. Investments involve risk and unless otherwise stated, are not guaranteed. Investors should understand the risks involved of owning investments, including interest rate risk, credit risk and market risk. Investment risks include loss of principal and fluctuating value. There is no guarantee an investing strategy will be successful. Past performance is not a guarantee of future results.