While there is plenty to discuss in the equity markets, I’d be remiss to not first acknowledge the suffering and tragedy that the people in Ukraine are experiencing. Here is to hope and prayer, that the devastation and loss of life is mitigated as much as possible.
It’s been slightly more than 24 hours since the Russian Invasion of Ukraine and while early and littered with a number of geopolitical dynamics, I’d like to at least offer some perspective from a stock market point of view.
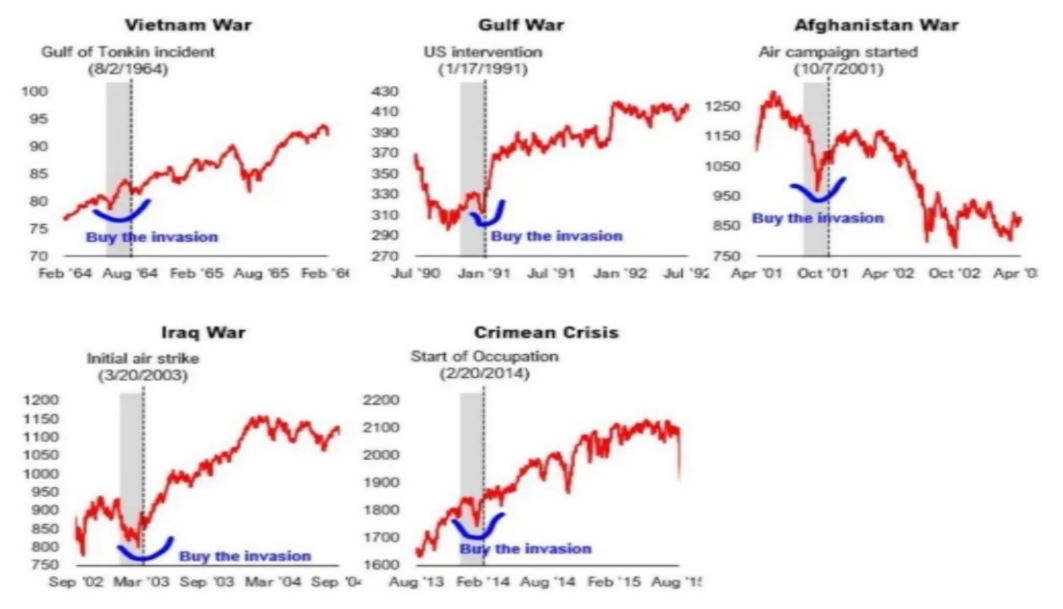
This invasion, similar to wars or invasions prior as you can see on this chart from Fundstrat and Bloomberg, was not a complete surprise to markets. There tends to be few things the market isn’t aware of or pricing in, in advance, although markets are known to both overshoot and undershoot in extreme bullish and bearish periods. In these 5 prior occurrences, the anticipation has often, but not always, led to a capitulatory bottom when conflict actually begins. On the 24th, or market trading day of the invasion by Russia, we saw over a 4% intraday swing in the S&P 500 and almost an 1000 point move to the better on the DJIA. The intraday bottom we’ve seen thus far has also marked a 22% drawdown in the Nasdaq from peak levels reached in November. To be clear, it’s uncertain whether a bottom is in, but we sure do appear to be in a bottoming process.
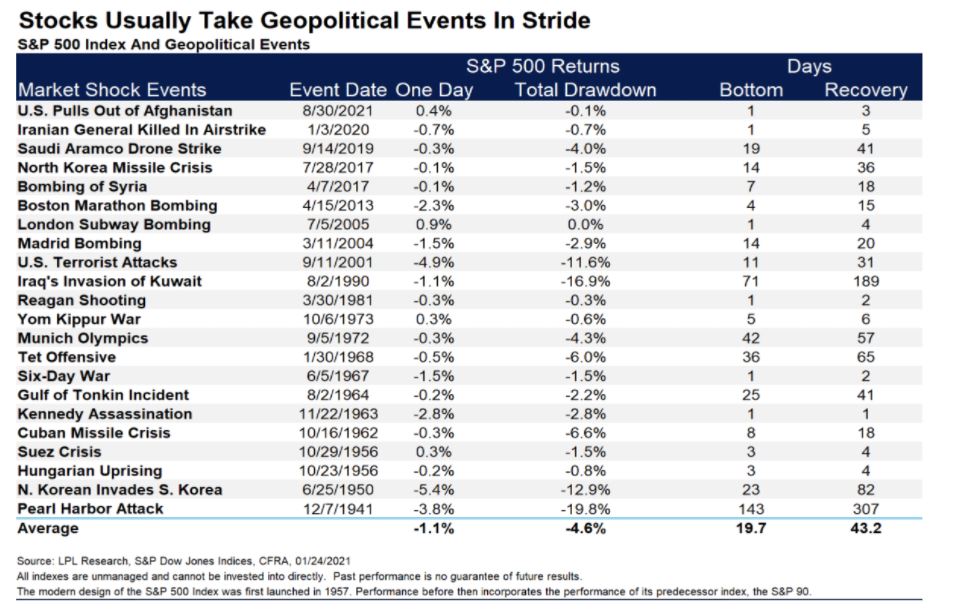
So at this stage of the sell-off process clearly dominated by headlines and emotion as opposed to fundamentals, technical analysis can help serve as a valuable guidepost in having an awareness of key levels of potential support. Two such levels include the mid 4000’s on the S&P, which marked the May 2021 lows as well as just above 3800, which is a key pivot point from January 2021. These levels certainly don’t need to be reached and because of the quick flow of capital, in part due to algorithmic trading nowadays, it’s not prudent to focus on them from a long-term investor’s perspective. I simply mention them in an attempt to further explore this bottoming process. Instead, it’s much more productive to focus on how quickly recoveries transpire as can be seen in these 22 previous Geopolitical events from LPL Research dating back to the 1940’s. Outside of the almost 20% decline during Pearl Harbor, which took almost a year to recover, the longest recovery period was about 6 months during Iraq’s invasion of Kuwait in 1990, which involved a market correction of almost 17%.
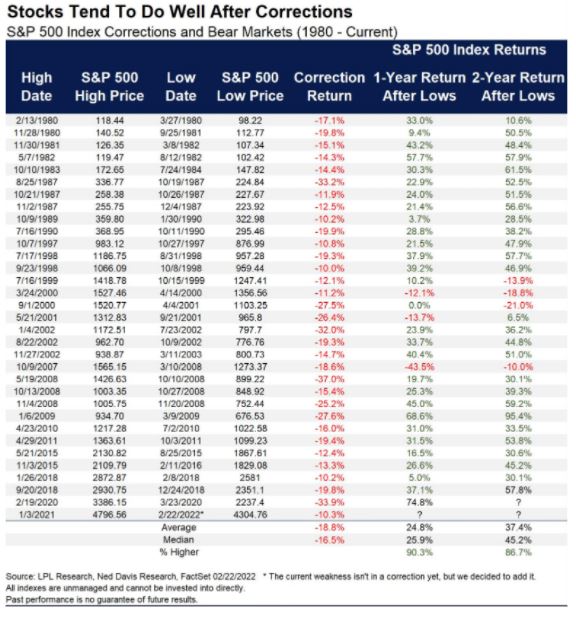
If we now shift our attention to market corrections, defined as a 10% decline, and bear markets, defined as a 20% decline, more broadly, there have been 33 such instances going back to 1980, as broken down here by LPL Research and Ned Davis. In each instance, outside of significant recessionary periods during the turn of the century tech bubble and the financial crisis of 2008, stocks rebounded meaningfully from the lows in focusing on the 1 and 2 year time frame. Worth noting, from peak to the most recent trough on February 24th, the S&P hit a decline of 14.6%, which ironically coincides with the average intra-year market decline going back to 1980, according to JP Morgan. This average intra-year correction of just over 14% going back to 1980, also isn’t too far off from the average of all the bear markets and corrections going back to 1980. Analogous to our kids asking if we’re there yet on those long, tiring road trips, we may have another stop or two, but we sure seem to be getting close.
I’ll leave you with three final thoughts: 1) Trust your investment process, assuming you have one 2) The steeper the declines, the sharper the snapbacks tend to be 3) Focus on the one to two-year view recognizing recession is still unlikely and the markets bounce back ability remains promising.